Analyzing CI Runs
We offer a straightforward CLI tool designed to analyze CI runs, focusing on Jobs and Steps, to provide deeper insights into system-level tests.
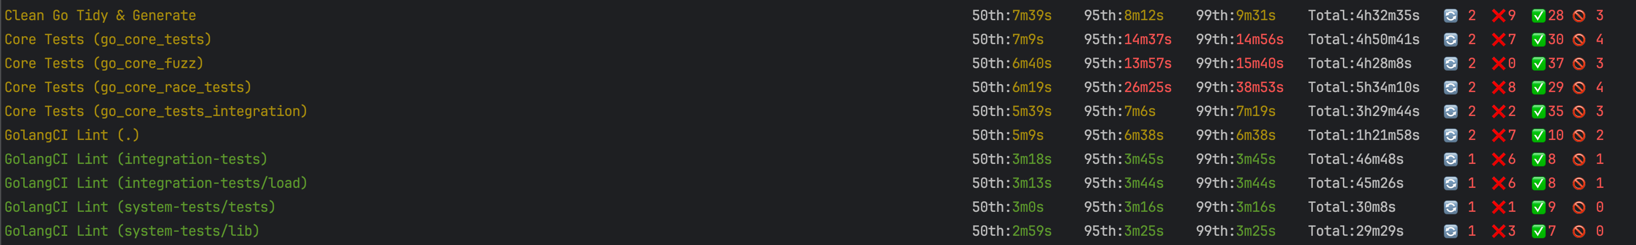
What to look for
Check execution times, results are sorted by median.
We exclude any runs without conclusion or if they have conclusion: "skipped".
🔄 - if you see high numbers here it means your pipeline is flaky, and it does not pass from the first attempt on some commits. It may indicate test flakiness!
🚫 - if numbers are high there it means your pipeline is constantly cancelled so it wastes time without bringing any results/value!
Examples
# GITHUB_TOKEN must have access to "actions" API
export GITHUB_TOKEN=...

# E2E test jobs from core for the last day
ctf ci -r "smartcontractkit/chainlink" -w "CI Core" -t jobs

# E2E test steps from core for the last day
ctf ci -r "smartcontractkit/chainlink" -w "CI Core" -t steps

# E2E tests from core for the last week (1k jobs limit!)
ctf ci -r "smartcontractkit/chainlink" -w "CI Core" -t jobs -s 7

# E2E tests from core for some specific days from 5 days ago to 3 days ago
ctf ci -r "smartcontractkit/chainlink" -w "CI Core" -t jobs -s 5 -e 3

# Last 3 days runs for e2e framework tests
ctf ci -r "smartcontractkit/chainlink-testing-framework" -w "Framework Golden Tests Examples" -t jobs -s 3
You can also use -debug flag to dump all the workflow runs/jobs to ctf-ci-debug folder.
All the results are also saved by default into ctf-ci-$uuid.json files so you can use this tool as CI performance linter.