WASP - Dashboard
warning
The API used to check and create alerts is unstable, and the information related to them may be out of date.
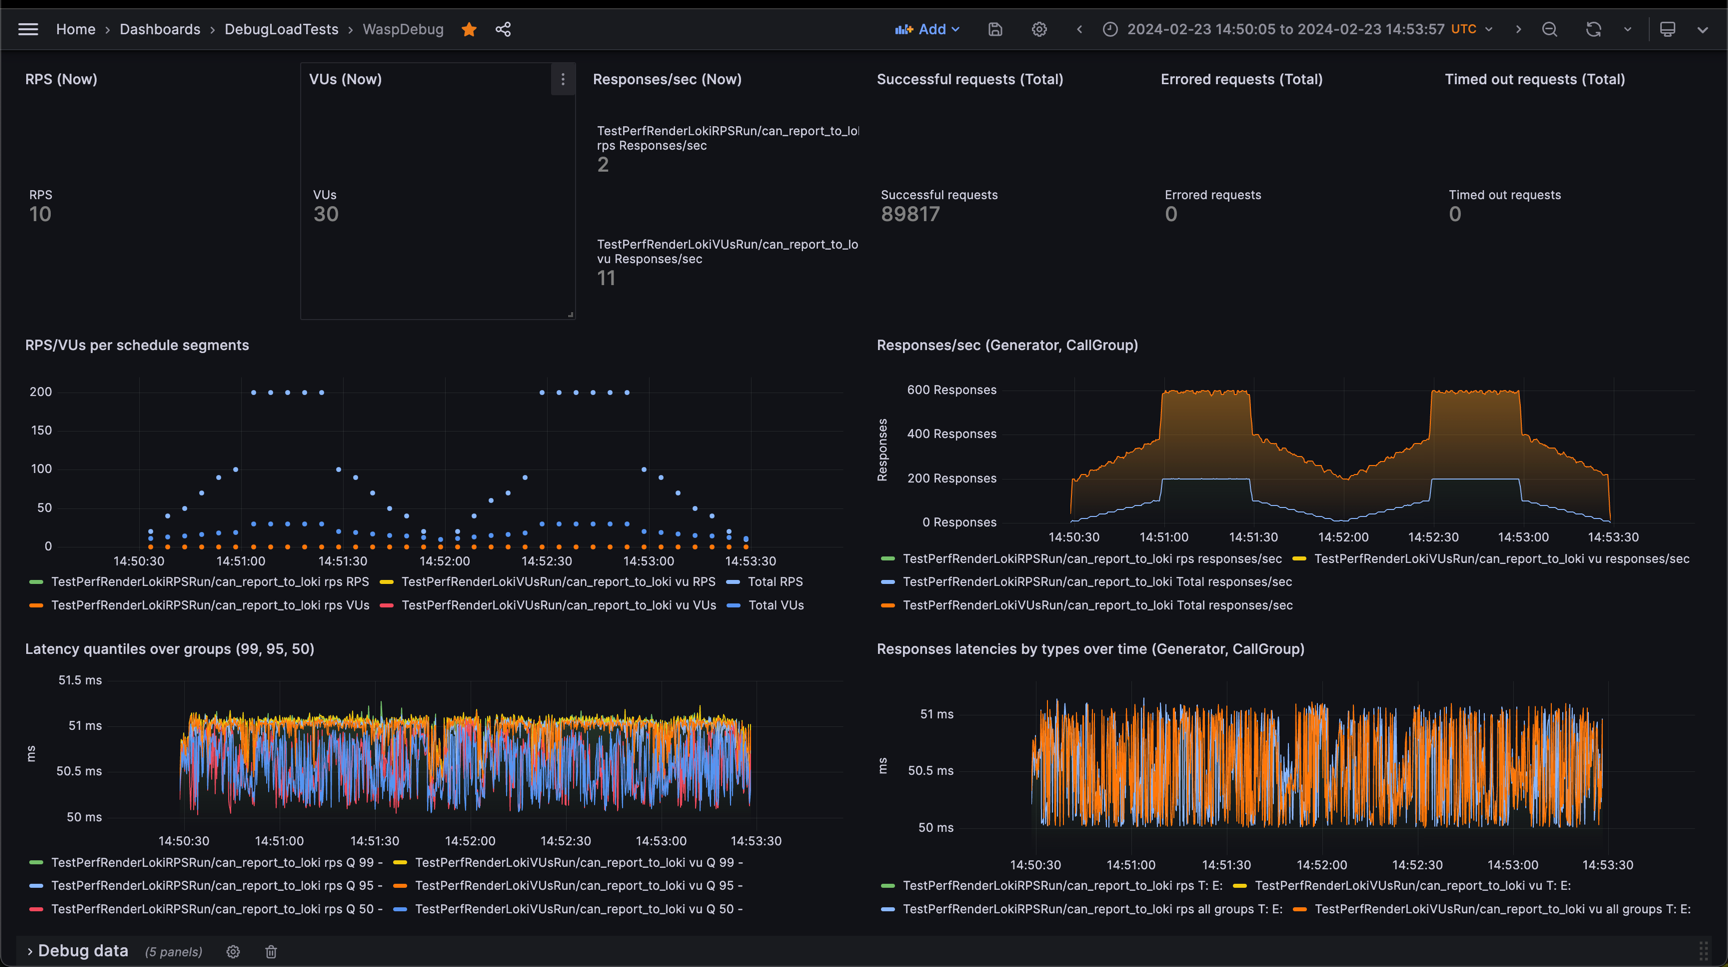
WASP comes with a built-in dashboard that allows you to monitor test runs in real-time.
The dashboard includes several built-in metrics that integrate seamlessly with the AlertChecker component.
It is built using the Grabana library, which you can use to further customize and extend the dashboard by adding your own rows and panels.
note
To create new dashboards, you need to set certain dashboard-specific variables as described in the Configuration section.
Predefined Alerts
WASP comes with predefined alerts for:
- 99th percentile of the response time
- Response errors
- Response timeouts
You can use these predefined metrics to add simple alerts to your dashboard for conditions such as:
- Values above or below a threshold
- Averages above or below a threshold
- Percentages of the total above or below a threshold
For a complete list of available conditions, refer to Grabana's ConditionEvaluator.
Custom Alerts
Custom alerts can be composed of:
- The simple conditions mentioned above
- Arbitrary Loki queries
Custom alerts use Grabana's timeseries.Alert and must be timeseries-based.
note
Adding a built-in alert will also add a new row to the dashboard to display the monitored metric.
In contrast, custom alerts do not automatically add rows to the dashboard to prevent clutter.
Each generator has its own metrics, matched by the generator name.
Default Dashboard Panels
The default dashboard includes the following panels:
- Current RPS/VUs (depending on the generator)
- Responses per second
- Total successful requests
- Total failed requests
- Total timeout requests
- RPS/VUs per schedule segment
- Responses per second
- Latency quantiles over groups (p99, p90, p50)
- Response latencies over time
- Logs size per second
- Sampling statistics
- Failed & timed-out responses
- Logs of the statistics-pushing service

Where applicable, these panels group results by generator name (gen_name label) and call group (call_group label).
note
You can read more about using labels in the Use labels section.
Creating a New Dashboard with Alerts
For a practical example of how to create a new dashboard with alerts, see the Testing Alerts section.