Intro
The Chainlink Testing Framework is a toolset designed for end-to-end testing of Chainlink products, focusing on functionality, resiliency, and performance.
This documentation is intended for:
- Chainlink engineers writing end-to-end tests in Golang
- Engineers using other languages who want to integrate with the Chainlink platform
To get started with writing system-level tests, refer to the Framework chapter, where we guide you from basic to more complex scenarios.
See mono repository tooling to start working with Go modules.
Repository contains two major pieces:
Framework
The primary focus of the Chainlink Testing Framework is to reduce the complexity of end-to-end testing, making complex system-level tests appear straightforward. It enables tests to run in any environment and serves as a single source of truth for system behavior as defined by requirements.
Features
-
Straightforward and sequential test composition: Tests are readable and give you precise control over key aspects in a strict step-by-step order.
-
Modular configuration: No arcane knowledge of framework settings is required; the config is simply a reflection of the components being used in the test. Components declare their own configuration—
what you see is what you get. -
Component isolation: Components are decoupled via input/output structs, without exposing internal details.
-
Replaceability and extensibility: Since components are decoupled via outputs, any deployment component can be swapped with a real service without altering the test code.
-
Quick local environments: A common setup can be launched in just
15seconds 🚀 *. -
Caching: Any component can use cached configs to skip setup for even faster test development.
-
Integrated observability stack: get all the info you need to develop end-to-end tests: metrics, logs, traces, profiles.
Generating Chainlink Environment
Our code generation tools automatically build complete Chainlink environments and test templates, which minimizes documentation and provides a framework that is both structured and easily extensible.
We provide a single environment for both quick and local developer environment and production-ready environments in Kubernetes.
Local Environment
Read help first and then build an environment for a single EVM network:
ctf gen -h
# generate a new Chainlink environment in "devenv" directory with 4 Chainlink nodes and one EVM network. Generate CLI called "pcli" and enter the shell
ctf gen env --cli pcli --product-name MyProduct --output-dir devenv --nodes 4
Follow further instructions in devenv/README.md.
Use devenv/AGENTS.md if you work with AI. You can also read that guide here:
Extending a Generated Environment (handy for environments generated before AGENTS.md was added).
Remote Environment
Infrastructure is deployed by internal operators so here we provide only configuration and tools to interact with deployed environments.
Generating Infrastructure Testing Template
Generate performance and chaos testing template for a Kubernetes namespace.
ctf gen load -h
# generate test suite named ChaosGen, with workload + default chaos experiments (fail + latency) for all the pods that have app.kubernetes.io/instance annotation
ctf gen load -w -n ChaosGen default
Configuration
We generate config specification for all our components automatically.
Here is full specification for what can be specificed in env.toml for devenv.
.out fields are useful in case you want to use remote component, or integrate in other language than Go, otherwise can be ignored.
Fakes
Fake HTTP service with recording capabilities.
[fakes]
  # Fake service image, usually can be found in our ECR with $project-fakes name
  image = ''
  # Docker container name
  container_name = ''
  # The port which Docker container is exposing
  port = 0

  # Fakes service config output
  [fakes.out]
    # Whether to respect caching or not, if cache = true component won't be deployed again
    use_cache = false
    # Base URL which can be used when running locally
    base_url_host = ''
    # Base URL to reach fakes service from other Docker containers
    base_url_docker = ''

    # Kubernetes service spec used to connect locally
    [fakes.out.k8s_service]
      Kind = ''
      APIVersion = ''
      Name = ''
      GenerateName = ''
      Namespace = ''
      SelfLink = ''
      UID = ''
      ResourceVersion = ''
      Generation = 0
      CreationTimestamp = '0001-01-01T00:00:00Z'
      DeletionTimestamp = '0001-01-01T00:00:00Z'
      DeletionGracePeriodSeconds = 0
      Finalizers = []

      [fakes.out.k8s_service.Labels]

      [fakes.out.k8s_service.Annotations]

      [[fakes.out.k8s_service.OwnerReferences]]
        APIVersion = ''
        Kind = ''
        Name = ''
        UID = ''
        Controller = false
        BlockOwnerDeletion = false

      [[fakes.out.k8s_service.ManagedFields]]
        Manager = ''
        Operation = ''
        APIVersion = ''
        Time = '0001-01-01T00:00:00Z'
        FieldsType = ''
        Subresource = ''

        [fakes.out.k8s_service.ManagedFields.FieldsV1]
          Raw = []

      [fakes.out.k8s_service.Spec]
        ClusterIP = ''
        ClusterIPs = []
        Type = ''
        ExternalIPs = []
        SessionAffinity = ''
        LoadBalancerIP = ''
        LoadBalancerSourceRanges = []
        ExternalName = ''
        ExternalTrafficPolicy = ''
        HealthCheckNodePort = 0
        PublishNotReadyAddresses = false
        IPFamilies = []
        IPFamilyPolicy = ''
        AllocateLoadBalancerNodePorts = false
        LoadBalancerClass = ''
        InternalTrafficPolicy = ''
        TrafficDistribution = ''

        [[fakes.out.k8s_service.Spec.Ports]]
          Name = ''
          Protocol = ''
          AppProtocol = ''
          Port = 0
          NodePort = 0

          [fakes.out.k8s_service.Spec.Ports.TargetPort]
            Type = 0
            IntVal = 0
            StrVal = ''

        [fakes.out.k8s_service.Spec.Selector]

        [fakes.out.k8s_service.Spec.SessionAffinityConfig]
          [fakes.out.k8s_service.Spec.SessionAffinityConfig.ClientIP]
            TimeoutSeconds = 0

      [fakes.out.k8s_service.Status]
        [fakes.out.k8s_service.Status.LoadBalancer]
          [[fakes.out.k8s_service.Status.LoadBalancer.Ingress]]
            IP = ''
            Hostname = ''
            IPMode = ''

            [[fakes.out.k8s_service.Status.LoadBalancer.Ingress.Ports]]
              Port = 0
              Protocol = ''
              Error = ''

        [[fakes.out.k8s_service.Status.Conditions]]
          Type = ''
          Status = ''
          ObservedGeneration = 0
          LastTransitionTime = '0001-01-01T00:00:00Z'
          Reason = ''
          Message = ''
Blockchains
Various types of blockchain nodes.
[[blockchains]]
  # Type can be one of: anvil geth besu solana aptos tron sui ton canton stellar, this struct describes common configuration we are using across all blockchains
  type = ''
  # Blockchain node image in format: $registry:$image, ex.: ghcr.io/foundry-rs/foundry:stable
  image = ''
  # Whether to pull image or not when creating Docker container
  pull_image = false
  # The port Docker container will expose
  port = ''
  # Docker container name
  container_name = ''
  # WebSocket port container will expose
  port_ws = ''
  # Blockchain chain ID
  chain_id = ''
  # Docker command parameters override, ex. for Anvil: ["-b", "1", "--mixed-mining"]
  docker_cmd_params = []
  # Public key to mint when solana-test-validator starts
  public_key = ''
  # Solana's contracts directory
  contracts_dir = ''
  # Custom ports pairs in format $host_port_number:$docker_port_number
  custom_ports = []
  # Sui blockchain network faucet port
  faucet_port = ''
  # Number of Canton network validators
  number_of_canton_validators = 0
  # GAPv2 specific parameter: host netowork mode, if 'true' will run environment in host network mode
  host_network_mode = false
  # GAPv2 specific parameter: path to default Ubuntu's certificates
  certificates_path = ''
  # Docker image platform, default is 'linux/amd64'
  image_platform = ''

  # blockchain deployment output
  [blockchains.out]
    # Whether to respect caching or not, if cache = true component won't be deployed again
    use_cache = false
    # Type can be one of: anvil geth besu solana aptos tron sui ton canton stellar, this struct describes common configuration we are using across all blockchains
    type = ''
    # Blockchain family, can be one of: evm solana aptos sui tron ton canton stellar
    family = ''
    # Blockchain Docker container name
    container_name = ''
    # Chain ID
    chain_id = ''

    # Blockchain network-specific data
    [blockchains.out.network_specific_data]
      # Sui network account info
      [blockchains.out.network_specific_data.sui_account]
        # Alias key name, usually null
        alias = ''
        # -
        flag = 0
        # Sui key scheme
        key_scheme = ''
        # Sui key mnemonic
        mnemonic = ''
        # Sui key peer ID
        peer_id = ''
        # Sui key in base64 format
        public_base64_key = ''
        # Sui key address
        sui_address = ''

      # Canton network data
      [blockchains.out.network_specific_data.canton_data]
        # Docker-internal endpoints, only reachable from containers connected to the same networks
        [blockchains.out.network_specific_data.canton_data.internal_endpoints]
          # https://docs.sync.global/app_dev/scan_api/index.html
          scan_api_url = ''
          # https://docs.sync.global/app_dev/token_standard/index.html#api-references
          registry_api_url = ''

          # Canton super validator endpoints
          [blockchains.out.network_specific_data.canton_data.internal_endpoints.super_validator]
            # https://docs.digitalasset.com/build/3.5/reference/json-api/json-api.html
            json_ledger_api_url = ''
            # https://docs.digitalasset.com/build/3.5/reference/lapi-proto-docs.html
            grpc_ledger_api_url = ''
            # https://docs.digitalasset.com/operate/3.5/howtos/configure/apis/admin_api.html
            admin_api_url = ''
            # https://docs.sync.global/app_dev/validator_api/index.html
            validator_api_url = ''
            # HTTP health check endpoint, responds on GET /health
            http_health_check_url = ''
            # GRPC health check endpoint, responds to grpc.health.v1.Health/Check
            grpc_health_check_url = ''
            # the user id associated with this participant, used in the JWT token
            user_id = ''
            # JSON Web Token for this participant
            jwt = ''

          # Canton participant endpoints
          [[blockchains.out.network_specific_data.canton_data.internal_endpoints.participants]]
            # https://docs.digitalasset.com/build/3.5/reference/json-api/json-api.html
            json_ledger_api_url = ''
            # https://docs.digitalasset.com/build/3.5/reference/lapi-proto-docs.html
            grpc_ledger_api_url = ''
            # https://docs.digitalasset.com/operate/3.5/howtos/configure/apis/admin_api.html
            admin_api_url = ''
            # https://docs.sync.global/app_dev/validator_api/index.html
            validator_api_url = ''
            # HTTP health check endpoint, responds on GET /health
            http_health_check_url = ''
            # GRPC health check endpoint, responds to grpc.health.v1.Health/Check
            grpc_health_check_url = ''
            # the user id associated with this participant, used in the JWT token
            user_id = ''
            # JSON Web Token for this participant
            jwt = ''

        # Docker-external endpoints, only reachable from the Docker host
        [blockchains.out.network_specific_data.canton_data.external_endpoints]
          # https://docs.sync.global/app_dev/scan_api/index.html
          scan_api_url = ''
          # https://docs.sync.global/app_dev/token_standard/index.html#api-references
          registry_api_url = ''

          # Canton super validator endpoints
          [blockchains.out.network_specific_data.canton_data.external_endpoints.super_validator]
            # https://docs.digitalasset.com/build/3.5/reference/json-api/json-api.html
            json_ledger_api_url = ''
            # https://docs.digitalasset.com/build/3.5/reference/lapi-proto-docs.html
            grpc_ledger_api_url = ''
            # https://docs.digitalasset.com/operate/3.5/howtos/configure/apis/admin_api.html
            admin_api_url = ''
            # https://docs.sync.global/app_dev/validator_api/index.html
            validator_api_url = ''
            # HTTP health check endpoint, responds on GET /health
            http_health_check_url = ''
            # GRPC health check endpoint, responds to grpc.health.v1.Health/Check
            grpc_health_check_url = ''
            # the user id associated with this participant, used in the JWT token
            user_id = ''
            # JSON Web Token for this participant
            jwt = ''

          # Canton participant endpoints
          [[blockchains.out.network_specific_data.canton_data.external_endpoints.participants]]
            # https://docs.digitalasset.com/build/3.5/reference/json-api/json-api.html
            json_ledger_api_url = ''
            # https://docs.digitalasset.com/build/3.5/reference/lapi-proto-docs.html
            grpc_ledger_api_url = ''
            # https://docs.digitalasset.com/operate/3.5/howtos/configure/apis/admin_api.html
            admin_api_url = ''
            # https://docs.sync.global/app_dev/validator_api/index.html
            validator_api_url = ''
            # HTTP health check endpoint, responds on GET /health
            http_health_check_url = ''
            # GRPC health check endpoint, responds to grpc.health.v1.Health/Check
            grpc_health_check_url = ''
            # the user id associated with this participant, used in the JWT token
            user_id = ''
            # JSON Web Token for this participant
            jwt = ''

      # Stellar network info
      [blockchains.out.network_specific_data.stellar_network]
        # Stellar network passphrase
        network_passphrase = ''
        # Friendbot faucet URL for funding accounts
        friendbot_url = ''

    # Blockchain nodes info
    [[blockchains.out.nodes]]
      # External blockchain node WebSocket URL
      ws_url = ''
      # External blockchain node HTTP URL
      http_url = ''
      # Internal blockchain node WebSocket URL
      internal_ws_url = ''
      # Internal blockchain node HTTP URL
      internal_http_url = ''

      # Kubernetes service spec used to connect locally
      [blockchains.out.nodes.k8s_service]
        Kind = ''
        APIVersion = ''
        Name = ''
        GenerateName = ''
        Namespace = ''
        SelfLink = ''
        UID = ''
        ResourceVersion = ''
        Generation = 0
        CreationTimestamp = '0001-01-01T00:00:00Z'
        DeletionTimestamp = '0001-01-01T00:00:00Z'
        DeletionGracePeriodSeconds = 0
        Finalizers = []

        [blockchains.out.nodes.k8s_service.Labels]

        [blockchains.out.nodes.k8s_service.Annotations]

        [[blockchains.out.nodes.k8s_service.OwnerReferences]]
          APIVersion = ''
          Kind = ''
          Name = ''
          UID = ''
          Controller = false
          BlockOwnerDeletion = false

        [[blockchains.out.nodes.k8s_service.ManagedFields]]
          Manager = ''
          Operation = ''
          APIVersion = ''
          Time = '0001-01-01T00:00:00Z'
          FieldsType = ''
          Subresource = ''

          [blockchains.out.nodes.k8s_service.ManagedFields.FieldsV1]
            Raw = []

        [blockchains.out.nodes.k8s_service.Spec]
          ClusterIP = ''
          ClusterIPs = []
          Type = ''
          ExternalIPs = []
          SessionAffinity = ''
          LoadBalancerIP = ''
          LoadBalancerSourceRanges = []
          ExternalName = ''
          ExternalTrafficPolicy = ''
          HealthCheckNodePort = 0
          PublishNotReadyAddresses = false
          IPFamilies = []
          IPFamilyPolicy = ''
          AllocateLoadBalancerNodePorts = false
          LoadBalancerClass = ''
          InternalTrafficPolicy = ''
          TrafficDistribution = ''

          [[blockchains.out.nodes.k8s_service.Spec.Ports]]
            Name = ''
            Protocol = ''
            AppProtocol = ''
            Port = 0
            NodePort = 0

            [blockchains.out.nodes.k8s_service.Spec.Ports.TargetPort]
              Type = 0
              IntVal = 0
              StrVal = ''

          [blockchains.out.nodes.k8s_service.Spec.Selector]

          [blockchains.out.nodes.k8s_service.Spec.SessionAffinityConfig]
            [blockchains.out.nodes.k8s_service.Spec.SessionAffinityConfig.ClientIP]
              TimeoutSeconds = 0

        [blockchains.out.nodes.k8s_service.Status]
          [blockchains.out.nodes.k8s_service.Status.LoadBalancer]
            [[blockchains.out.nodes.k8s_service.Status.LoadBalancer.Ingress]]
              IP = ''
              Hostname = ''
              IPMode = ''

              [[blockchains.out.nodes.k8s_service.Status.LoadBalancer.Ingress.Ports]]
                Port = 0
                Protocol = ''
                Error = ''

          [[blockchains.out.nodes.k8s_service.Status.Conditions]]
            Type = ''
            Status = ''
            ObservedGeneration = 0
            LastTransitionTime = '0001-01-01T00:00:00Z'
            Reason = ''
            Message = ''

  # Solana's programs, map of program name to program ID, there needs to be a matching .so file in contracts_dir
  [blockchains.solana_programs]

  # Docker container resources
  [blockchains.resources]
    # CPU shares, ex.: 2
    cpus = 0.0
    # Memory in MegaBytes, ex.:"200"
    memory_mb = 0

  # Docker container environment variables in TOML format key = value
  [blockchains.custom_env]
Node Set
Chainlink node set forming a Decentralized Oracle Network.
[[nodesets]]
# Node set name, ex.:'don-1', Docker containers will be prefixed with this name so tests can distinguish one DON from another
name = ''
# Number of nodes in node set
nodes = 0
# HTTP ports range starting with port X and increasing by 1
http_port_range_start = 0
# P2P ports range starting with port X and increasing by 1
p2p_port_range_start = 0
# Delve debugger ports range starting with port X and increasing by 1
dlv_port_range_start = 0
# Override mode, applicable only to 'localcre'. Changes how config overrides to TOML nodes apply
override_mode = ''
# Turn DNS on, helpful to isolate container from the internet
no_dns = false
# Shared node set data base input for PostgreSQL
[nodesets.db]
# PostgreSQL Docker image in format: $registry:$tag
image = ''
# PostgreSQL connection port
port = 0
# PostgreSQL container name
name = ''
# PostgreSQL docker volume name
volume_name = ''
# Number of pre-created databases for Chainlink nodes
databases = 0
# Whether to create JobDistributor database or not
jd_database = false
# JobDistributor database dump path to load
jd_sql_dump_path = ''
# Whether to pull PostgreSQL image or not
pull_image = false
# Docker container resources
[nodesets.db.resources]
# CPU shares, ex.: 2
cpus = 0.0
# Memory in MegaBytes, ex.:"200"
memory_mb = 0
# PostgreSQL config output
[nodesets.db.out]
# PostgreSQL connection URL
url = ''
# Docker container name
container_name = ''
# PostgreSQL internal connection URL
internal_url = ''
# PostgreSQL internal connection URL to JobDistributor database
jd_url = ''
# PostgreSQL internal connection URL to JobDistributor database
jd_internal_url = ''
# Kubernetes service spec used to connect locally
[nodesets.db.out.k8s_service]
Kind = ''
APIVersion = ''
Name = ''
GenerateName = ''
Namespace = ''
SelfLink = ''
UID = ''
ResourceVersion = ''
Generation = 0
CreationTimestamp = '0001-01-01T00:00:00Z'
DeletionTimestamp = '0001-01-01T00:00:00Z'
DeletionGracePeriodSeconds = 0
Finalizers = []
[nodesets.db.out.k8s_service.Labels]
[nodesets.db.out.k8s_service.Annotations]
[[nodesets.db.out.k8s_service.OwnerReferences]]
APIVersion = ''
Kind = ''
Name = ''
UID = ''
Controller = false
BlockOwnerDeletion = false
[[nodesets.db.out.k8s_service.ManagedFields]]
Manager = ''
Operation = ''
APIVersion = ''
Time = '0001-01-01T00:00:00Z'
FieldsType = ''
Subresource = ''
[nodesets.db.out.k8s_service.ManagedFields.FieldsV1]
Raw = []
[nodesets.db.out.k8s_service.Spec]
ClusterIP = ''
ClusterIPs = []
Type = ''
ExternalIPs = []
SessionAffinity = ''
LoadBalancerIP = ''
LoadBalancerSourceRanges = []
ExternalName = ''
ExternalTrafficPolicy = ''
HealthCheckNodePort = 0
PublishNotReadyAddresses = false
IPFamilies = []
IPFamilyPolicy = ''
AllocateLoadBalancerNodePorts = false
LoadBalancerClass = ''
InternalTrafficPolicy = ''
TrafficDistribution = ''
[[nodesets.db.out.k8s_service.Spec.Ports]]
Name = ''
Protocol = ''
AppProtocol = ''
Port = 0
NodePort = 0
[nodesets.db.out.k8s_service.Spec.Ports.TargetPort]
Type = 0
IntVal = 0
StrVal = ''
[nodesets.db.out.k8s_service.Spec.Selector]
[nodesets.db.out.k8s_service.Spec.SessionAffinityConfig]
[nodesets.db.out.k8s_service.Spec.SessionAffinityConfig.ClientIP]
TimeoutSeconds = 0
[nodesets.db.out.k8s_service.Status]
[nodesets.db.out.k8s_service.Status.LoadBalancer]
[[nodesets.db.out.k8s_service.Status.LoadBalancer.Ingress]]
IP = ''
Hostname = ''
IPMode = ''
[[nodesets.db.out.k8s_service.Status.LoadBalancer.Ingress.Ports]]
Port = 0
Protocol = ''
Error = ''
[[nodesets.db.out.k8s_service.Status.Conditions]]
Type = ''
Status = ''
ObservedGeneration = 0
LastTransitionTime = '0001-01-01T00:00:00Z'
Reason = ''
Message = ''
# Chainlink node TOML configurations
[[nodesets.node_specs]]
# whether to allow DNS in Docker containers or not, useful for isolating containers from network if set to 'false'
no_dns = false
# PostgreSQL database configuration
[nodesets.node_specs.db]
# PostgreSQL Docker image in format: $registry:$tag
image = ''
# PostgreSQL connection port
port = 0
# PostgreSQL container name
name = ''
# PostgreSQL docker volume name
volume_name = ''
# Number of pre-created databases for Chainlink nodes
databases = 0
# Whether to create JobDistributor database or not
jd_database = false
# JobDistributor database dump path to load
jd_sql_dump_path = ''
# Whether to pull PostgreSQL image or not
pull_image = false
# Docker container resources
[nodesets.node_specs.db.resources]
# CPU shares, ex.: 2
cpus = 0.0
# Memory in MegaBytes, ex.:"200"
memory_mb = 0
# PostgreSQL config output
[nodesets.node_specs.db.out]
# PostgreSQL connection URL
url = ''
# Docker container name
container_name = ''
# PostgreSQL internal connection URL
internal_url = ''
# PostgreSQL internal connection URL to JobDistributor database
jd_url = ''
# PostgreSQL internal connection URL to JobDistributor database
jd_internal_url = ''
# Kubernetes service spec used to connect locally
[nodesets.node_specs.db.out.k8s_service]
Kind = ''
APIVersion = ''
Name = ''
GenerateName = ''
Namespace = ''
SelfLink = ''
UID = ''
ResourceVersion = ''
Generation = 0
CreationTimestamp = '0001-01-01T00:00:00Z'
DeletionTimestamp = '0001-01-01T00:00:00Z'
DeletionGracePeriodSeconds = 0
Finalizers = []
[nodesets.node_specs.db.out.k8s_service.Labels]
[nodesets.node_specs.db.out.k8s_service.Annotations]
[[nodesets.node_specs.db.out.k8s_service.OwnerReferences]]
APIVersion = ''
Kind = ''
Name = ''
UID = ''
Controller = false
BlockOwnerDeletion = false
[[nodesets.node_specs.db.out.k8s_service.ManagedFields]]
Manager = ''
Operation = ''
APIVersion = ''
Time = '0001-01-01T00:00:00Z'
FieldsType = ''
Subresource = ''
[nodesets.node_specs.db.out.k8s_service.ManagedFields.FieldsV1]
Raw = []
[nodesets.node_specs.db.out.k8s_service.Spec]
ClusterIP = ''
ClusterIPs = []
Type = ''
ExternalIPs = []
SessionAffinity = ''
LoadBalancerIP = ''
LoadBalancerSourceRanges = []
ExternalName = ''
ExternalTrafficPolicy = ''
HealthCheckNodePort = 0
PublishNotReadyAddresses = false
IPFamilies = []
IPFamilyPolicy = ''
AllocateLoadBalancerNodePorts = false
LoadBalancerClass = ''
InternalTrafficPolicy = ''
TrafficDistribution = ''
[[nodesets.node_specs.db.out.k8s_service.Spec.Ports]]
Name = ''
Protocol = ''
AppProtocol = ''
Port = 0
NodePort = 0
[nodesets.node_specs.db.out.k8s_service.Spec.Ports.TargetPort]
Type = 0
IntVal = 0
StrVal = ''
[nodesets.node_specs.db.out.k8s_service.Spec.Selector]
[nodesets.node_specs.db.out.k8s_service.Spec.SessionAffinityConfig]
[nodesets.node_specs.db.out.k8s_service.Spec.SessionAffinityConfig.ClientIP]
TimeoutSeconds = 0
[nodesets.node_specs.db.out.k8s_service.Status]
[nodesets.node_specs.db.out.k8s_service.Status.LoadBalancer]
[[nodesets.node_specs.db.out.k8s_service.Status.LoadBalancer.Ingress]]
IP = ''
Hostname = ''
IPMode = ''
[[nodesets.node_specs.db.out.k8s_service.Status.LoadBalancer.Ingress.Ports]]
Port = 0
Protocol = ''
Error = ''
[[nodesets.node_specs.db.out.k8s_service.Status.Conditions]]
Type = ''
Status = ''
ObservedGeneration = 0
LastTransitionTime = '0001-01-01T00:00:00Z'
Reason = ''
Message = ''
# Chainlink node configuration
[nodesets.node_specs.node]
# Chainlink node Docker image in format $registry:$tag
image = ''
# Chainlink node Docker container name
name = ''
# Docker file path to rebuild, relative to 'docker_ctx' field path
docker_file = ''
# Docker build context path
docker_ctx = ''
# Whether to pull Docker image or not
pull_image = false
# Chainlink CRE capabilities paths for WASM binaries
capabilities = []
# path to capabilities inside Docker container (capabilities are copied inside container from local path)
capabilities_container_dir = ''
# node config overrides field for programmatic usage in tests
test_config_overrides = ''
# node config overrides field for manual overrides from env.toml configs
user_config_overrides = ''
# node secrets config overrides field for programmatic usage in tests
test_secrets_overrides = ''
# node secrets config overrides field for manual overrides from env.toml configs
user_secrets_overrides = ''
# Chainlink node API HTTP port
port = 0
# Chainlink node P2P port
p2p_port = 0
# Custom ports pairs in format $host_port_number:$docker_port_number
custom_ports = []
# Delve debugger port
debugger_port = 0
# Docker build args in format key = value or map format, ex.: "CL_IS_PROD_BUILD" = "false"
[nodesets.node_specs.node.docker_build_args]
# Docker container resources
[nodesets.node_specs.node.resources]
# CPU shares, ex.: 2
cpus = 0.0
# Memory in MegaBytes, ex.:"200"
memory_mb = 0
# Docker container environment variables
[nodesets.node_specs.node.env_vars]
# Chainlink node configuration output
[nodesets.node_specs.out]
# Whether to respect caching or not, if cache = true component won't be deployed again
use_cache = false
# Chainlink node config output
[nodesets.node_specs.out.node]
# User name for basic login/password authorization in Chainlink node
api_auth_user = ''
# Password for basic login/password authorization in Chainlink node
api_auth_password = ''
# Node Docker contaner name
container_name = ''
# Node external API HTTP URL
url = ''
# Node internal API HTTP URL
internal_url = ''
# Node internal P2P URL
p2p_internal_url = ''
# Node internal IP
internal_ip = ''
# Kubernetes service spec used to connect locally
[nodesets.node_specs.out.node.k8s_service]
Kind = ''
APIVersion = ''
Name = ''
GenerateName = ''
Namespace = ''
SelfLink = ''
UID = ''
ResourceVersion = ''
Generation = 0
CreationTimestamp = '0001-01-01T00:00:00Z'
DeletionTimestamp = '0001-01-01T00:00:00Z'
DeletionGracePeriodSeconds = 0
Finalizers = []
[nodesets.node_specs.out.node.k8s_service.Labels]
[nodesets.node_specs.out.node.k8s_service.Annotations]
[[nodesets.node_specs.out.node.k8s_service.OwnerReferences]]
APIVersion = ''
Kind = ''
Name = ''
UID = ''
Controller = false
BlockOwnerDeletion = false
[[nodesets.node_specs.out.node.k8s_service.ManagedFields]]
Manager = ''
Operation = ''
APIVersion = ''
Time = '0001-01-01T00:00:00Z'
FieldsType = ''
Subresource = ''
[nodesets.node_specs.out.node.k8s_service.ManagedFields.FieldsV1]
Raw = []
[nodesets.node_specs.out.node.k8s_service.Spec]
ClusterIP = ''
ClusterIPs = []
Type = ''
ExternalIPs = []
SessionAffinity = ''
LoadBalancerIP = ''
LoadBalancerSourceRanges = []
ExternalName = ''
ExternalTrafficPolicy = ''
HealthCheckNodePort = 0
PublishNotReadyAddresses = false
IPFamilies = []
IPFamilyPolicy = ''
AllocateLoadBalancerNodePorts = false
LoadBalancerClass = ''
InternalTrafficPolicy = ''
TrafficDistribution = ''
[[nodesets.node_specs.out.node.k8s_service.Spec.Ports]]
Name = ''
Protocol = ''
AppProtocol = ''
Port = 0
NodePort = 0
[nodesets.node_specs.out.node.k8s_service.Spec.Ports.TargetPort]
Type = 0
IntVal = 0
StrVal = ''
[nodesets.node_specs.out.node.k8s_service.Spec.Selector]
[nodesets.node_specs.out.node.k8s_service.Spec.SessionAffinityConfig]
[nodesets.node_specs.out.node.k8s_service.Spec.SessionAffinityConfig.ClientIP]
TimeoutSeconds = 0
[nodesets.node_specs.out.node.k8s_service.Status]
[nodesets.node_specs.out.node.k8s_service.Status.LoadBalancer]
[[nodesets.node_specs.out.node.k8s_service.Status.LoadBalancer.Ingress]]
IP = ''
Hostname = ''
IPMode = ''
[[nodesets.node_specs.out.node.k8s_service.Status.LoadBalancer.Ingress.Ports]]
Port = 0
Protocol = ''
Error = ''
[[nodesets.node_specs.out.node.k8s_service.Status.Conditions]]
Type = ''
Status = ''
ObservedGeneration = 0
LastTransitionTime = '0001-01-01T00:00:00Z'
Reason = ''
Message = ''
# PostgreSQL config output
[nodesets.node_specs.out.postgresql]
# PostgreSQL connection URL
url = ''
# Docker container name
container_name = ''
# PostgreSQL internal connection URL
internal_url = ''
# PostgreSQL internal connection URL to JobDistributor database
jd_url = ''
# PostgreSQL internal connection URL to JobDistributor database
jd_internal_url = ''
# Kubernetes service spec used to connect locally
[nodesets.node_specs.out.postgresql.k8s_service]
Kind = ''
APIVersion = ''
Name = ''
GenerateName = ''
Namespace = ''
SelfLink = ''
UID = ''
ResourceVersion = ''
Generation = 0
CreationTimestamp = '0001-01-01T00:00:00Z'
DeletionTimestamp = '0001-01-01T00:00:00Z'
DeletionGracePeriodSeconds = 0
Finalizers = []
[nodesets.node_specs.out.postgresql.k8s_service.Labels]
[nodesets.node_specs.out.postgresql.k8s_service.Annotations]
[[nodesets.node_specs.out.postgresql.k8s_service.OwnerReferences]]
APIVersion = ''
Kind = ''
Name = ''
UID = ''
Controller = false
BlockOwnerDeletion = false
[[nodesets.node_specs.out.postgresql.k8s_service.ManagedFields]]
Manager = ''
Operation = ''
APIVersion = ''
Time = '0001-01-01T00:00:00Z'
FieldsType = ''
Subresource = ''
[nodesets.node_specs.out.postgresql.k8s_service.ManagedFields.FieldsV1]
Raw = []
[nodesets.node_specs.out.postgresql.k8s_service.Spec]
ClusterIP = ''
ClusterIPs = []
Type = ''
ExternalIPs = []
SessionAffinity = ''
LoadBalancerIP = ''
LoadBalancerSourceRanges = []
ExternalName = ''
ExternalTrafficPolicy = ''
HealthCheckNodePort = 0
PublishNotReadyAddresses = false
IPFamilies = []
IPFamilyPolicy = ''
AllocateLoadBalancerNodePorts = false
LoadBalancerClass = ''
InternalTrafficPolicy = ''
TrafficDistribution = ''
[[nodesets.node_specs.out.postgresql.k8s_service.Spec.Ports]]
Name = ''
Protocol = ''
AppProtocol = ''
Port = 0
NodePort = 0
[nodesets.node_specs.out.postgresql.k8s_service.Spec.Ports.TargetPort]
Type = 0
IntVal = 0
StrVal = ''
[nodesets.node_specs.out.postgresql.k8s_service.Spec.Selector]
[nodesets.node_specs.out.postgresql.k8s_service.Spec.SessionAffinityConfig]
[nodesets.node_specs.out.postgresql.k8s_service.Spec.SessionAffinityConfig.ClientIP]
TimeoutSeconds = 0
[nodesets.node_specs.out.postgresql.k8s_service.Status]
[nodesets.node_specs.out.postgresql.k8s_service.Status.LoadBalancer]
[[nodesets.node_specs.out.postgresql.k8s_service.Status.LoadBalancer.Ingress]]
IP = ''
Hostname = ''
IPMode = ''
[[nodesets.node_specs.out.postgresql.k8s_service.Status.LoadBalancer.Ingress.Ports]]
Port = 0
Protocol = ''
Error = ''
[[nodesets.node_specs.out.postgresql.k8s_service.Status.Conditions]]
Type = ''
Status = ''
ObservedGeneration = 0
LastTransitionTime = '0001-01-01T00:00:00Z'
Reason = ''
Message = ''
# Nodeset config output
[nodesets.out]
# Whether to respect caching or not, if cache = true component won't be deployed again
use_cache = false
# Nodeset shared database output (PostgreSQL)
[nodesets.out.db_out]
# PostgreSQL connection URL
url = ''
# Docker container name
container_name = ''
# PostgreSQL internal connection URL
internal_url = ''
# PostgreSQL internal connection URL to JobDistributor database
jd_url = ''
# PostgreSQL internal connection URL to JobDistributor database
jd_internal_url = ''
# Kubernetes service spec used to connect locally
[nodesets.out.db_out.k8s_service]
Kind = ''
APIVersion = ''
Name = ''
GenerateName = ''
Namespace = ''
SelfLink = ''
UID = ''
ResourceVersion = ''
Generation = 0
CreationTimestamp = '0001-01-01T00:00:00Z'
DeletionTimestamp = '0001-01-01T00:00:00Z'
DeletionGracePeriodSeconds = 0
Finalizers = []
[nodesets.out.db_out.k8s_service.Labels]
[nodesets.out.db_out.k8s_service.Annotations]
[[nodesets.out.db_out.k8s_service.OwnerReferences]]
APIVersion = ''
Kind = ''
Name = ''
UID = ''
Controller = false
BlockOwnerDeletion = false
[[nodesets.out.db_out.k8s_service.ManagedFields]]
Manager = ''
Operation = ''
APIVersion = ''
Time = '0001-01-01T00:00:00Z'
FieldsType = ''
Subresource = ''
[nodesets.out.db_out.k8s_service.ManagedFields.FieldsV1]
Raw = []
[nodesets.out.db_out.k8s_service.Spec]
ClusterIP = ''
ClusterIPs = []
Type = ''
ExternalIPs = []
SessionAffinity = ''
LoadBalancerIP = ''
LoadBalancerSourceRanges = []
ExternalName = ''
ExternalTrafficPolicy = ''
HealthCheckNodePort = 0
PublishNotReadyAddresses = false
IPFamilies = []
IPFamilyPolicy = ''
AllocateLoadBalancerNodePorts = false
LoadBalancerClass = ''
InternalTrafficPolicy = ''
TrafficDistribution = ''
[[nodesets.out.db_out.k8s_service.Spec.Ports]]
Name = ''
Protocol = ''
AppProtocol = ''
Port = 0
NodePort = 0
[nodesets.out.db_out.k8s_service.Spec.Ports.TargetPort]
Type = 0
IntVal = 0
StrVal = ''
[nodesets.out.db_out.k8s_service.Spec.Selector]
[nodesets.out.db_out.k8s_service.Spec.SessionAffinityConfig]
[nodesets.out.db_out.k8s_service.Spec.SessionAffinityConfig.ClientIP]
TimeoutSeconds = 0
[nodesets.out.db_out.k8s_service.Status]
[nodesets.out.db_out.k8s_service.Status.LoadBalancer]
[[nodesets.out.db_out.k8s_service.Status.LoadBalancer.Ingress]]
IP = ''
Hostname = ''
IPMode = ''
[[nodesets.out.db_out.k8s_service.Status.LoadBalancer.Ingress.Ports]]
Port = 0
Protocol = ''
Error = ''
[[nodesets.out.db_out.k8s_service.Status.Conditions]]
Type = ''
Status = ''
ObservedGeneration = 0
LastTransitionTime = '0001-01-01T00:00:00Z'
Reason = ''
Message = ''
# Chainlink node config outputs
[[nodesets.out.cl_nodes]]
# Whether to respect caching or not, if cache = true component won't be deployed again
use_cache = false
# Chainlink node config output
[nodesets.out.cl_nodes.node]
# User name for basic login/password authorization in Chainlink node
api_auth_user = ''
# Password for basic login/password authorization in Chainlink node
api_auth_password = ''
# Node Docker contaner name
container_name = ''
# Node external API HTTP URL
url = ''
# Node internal API HTTP URL
internal_url = ''
# Node internal P2P URL
p2p_internal_url = ''
# Node internal IP
internal_ip = ''
# Kubernetes service spec used to connect locally
[nodesets.out.cl_nodes.node.k8s_service]
Kind = ''
APIVersion = ''
Name = ''
GenerateName = ''
Namespace = ''
SelfLink = ''
UID = ''
ResourceVersion = ''
Generation = 0
CreationTimestamp = '0001-01-01T00:00:00Z'
DeletionTimestamp = '0001-01-01T00:00:00Z'
DeletionGracePeriodSeconds = 0
Finalizers = []
[nodesets.out.cl_nodes.node.k8s_service.Labels]
[nodesets.out.cl_nodes.node.k8s_service.Annotations]
[[nodesets.out.cl_nodes.node.k8s_service.OwnerReferences]]
APIVersion = ''
Kind = ''
Name = ''
UID = ''
Controller = false
BlockOwnerDeletion = false
[[nodesets.out.cl_nodes.node.k8s_service.ManagedFields]]
Manager = ''
Operation = ''
APIVersion = ''
Time = '0001-01-01T00:00:00Z'
FieldsType = ''
Subresource = ''
[nodesets.out.cl_nodes.node.k8s_service.ManagedFields.FieldsV1]
Raw = []
[nodesets.out.cl_nodes.node.k8s_service.Spec]
ClusterIP = ''
ClusterIPs = []
Type = ''
ExternalIPs = []
SessionAffinity = ''
LoadBalancerIP = ''
LoadBalancerSourceRanges = []
ExternalName = ''
ExternalTrafficPolicy = ''
HealthCheckNodePort = 0
PublishNotReadyAddresses = false
IPFamilies = []
IPFamilyPolicy = ''
AllocateLoadBalancerNodePorts = false
LoadBalancerClass = ''
InternalTrafficPolicy = ''
TrafficDistribution = ''
[[nodesets.out.cl_nodes.node.k8s_service.Spec.Ports]]
Name = ''
Protocol = ''
AppProtocol = ''
Port = 0
NodePort = 0
[nodesets.out.cl_nodes.node.k8s_service.Spec.Ports.TargetPort]
Type = 0
IntVal = 0
StrVal = ''
[nodesets.out.cl_nodes.node.k8s_service.Spec.Selector]
[nodesets.out.cl_nodes.node.k8s_service.Spec.SessionAffinityConfig]
[nodesets.out.cl_nodes.node.k8s_service.Spec.SessionAffinityConfig.ClientIP]
TimeoutSeconds = 0
[nodesets.out.cl_nodes.node.k8s_service.Status]
[nodesets.out.cl_nodes.node.k8s_service.Status.LoadBalancer]
[[nodesets.out.cl_nodes.node.k8s_service.Status.LoadBalancer.Ingress]]
IP = ''
Hostname = ''
IPMode = ''
[[nodesets.out.cl_nodes.node.k8s_service.Status.LoadBalancer.Ingress.Ports]]
Port = 0
Protocol = ''
Error = ''
[[nodesets.out.cl_nodes.node.k8s_service.Status.Conditions]]
Type = ''
Status = ''
ObservedGeneration = 0
LastTransitionTime = '0001-01-01T00:00:00Z'
Reason = ''
Message = ''
# PostgreSQL config output
[nodesets.out.cl_nodes.postgresql]
# PostgreSQL connection URL
url = ''
# Docker container name
container_name = ''
# PostgreSQL internal connection URL
internal_url = ''
# PostgreSQL internal connection URL to JobDistributor database
jd_url = ''
# PostgreSQL internal connection URL to JobDistributor database
jd_internal_url = ''
# Kubernetes service spec used to connect locally
[nodesets.out.cl_nodes.postgresql.k8s_service]
Kind = ''
APIVersion = ''
Name = ''
GenerateName = ''
Namespace = ''
SelfLink = ''
UID = ''
ResourceVersion = ''
Generation = 0
CreationTimestamp = '0001-01-01T00:00:00Z'
DeletionTimestamp = '0001-01-01T00:00:00Z'
DeletionGracePeriodSeconds = 0
Finalizers = []
[nodesets.out.cl_nodes.postgresql.k8s_service.Labels]
[nodesets.out.cl_nodes.postgresql.k8s_service.Annotations]
[[nodesets.out.cl_nodes.postgresql.k8s_service.OwnerReferences]]
APIVersion = ''
Kind = ''
Name = ''
UID = ''
Controller = false
BlockOwnerDeletion = false
[[nodesets.out.cl_nodes.postgresql.k8s_service.ManagedFields]]
Manager = ''
Operation = ''
APIVersion = ''
Time = '0001-01-01T00:00:00Z'
FieldsType = ''
Subresource = ''
[nodesets.out.cl_nodes.postgresql.k8s_service.ManagedFields.FieldsV1]
Raw = []
[nodesets.out.cl_nodes.postgresql.k8s_service.Spec]
ClusterIP = ''
ClusterIPs = []
Type = ''
ExternalIPs = []
SessionAffinity = ''
LoadBalancerIP = ''
LoadBalancerSourceRanges = []
ExternalName = ''
ExternalTrafficPolicy = ''
HealthCheckNodePort = 0
PublishNotReadyAddresses = false
IPFamilies = []
IPFamilyPolicy = ''
AllocateLoadBalancerNodePorts = false
LoadBalancerClass = ''
InternalTrafficPolicy = ''
TrafficDistribution = ''
[[nodesets.out.cl_nodes.postgresql.k8s_service.Spec.Ports]]
Name = ''
Protocol = ''
AppProtocol = ''
Port = 0
NodePort = 0
[nodesets.out.cl_nodes.postgresql.k8s_service.Spec.Ports.TargetPort]
Type = 0
IntVal = 0
StrVal = ''
[nodesets.out.cl_nodes.postgresql.k8s_service.Spec.Selector]
[nodesets.out.cl_nodes.postgresql.k8s_service.Spec.SessionAffinityConfig]
[nodesets.out.cl_nodes.postgresql.k8s_service.Spec.SessionAffinityConfig.ClientIP]
TimeoutSeconds = 0
[nodesets.out.cl_nodes.postgresql.k8s_service.Status]
[nodesets.out.cl_nodes.postgresql.k8s_service.Status.LoadBalancer]
[[nodesets.out.cl_nodes.postgresql.k8s_service.Status.LoadBalancer.Ingress]]
IP = ''
Hostname = ''
IPMode = ''
[[nodesets.out.cl_nodes.postgresql.k8s_service.Status.LoadBalancer.Ingress.Ports]]
Port = 0
Protocol = ''
Error = ''
[[nodesets.out.cl_nodes.postgresql.k8s_service.Status.Conditions]]
Type = ''
Status = ''
ObservedGeneration = 0
LastTransitionTime = '0001-01-01T00:00:00Z'
Reason = ''
Message = ''
External Environment Integration
Developer environment exposes format which allows any external infra to be integrated.
NodeSets + Blockchains + Fake
This is a basic example of data required to run developer environment commands on external infrastructure. Full list of fields can be found here
Example env-stage-1.toml:
[fakes]
  [fakes.out]
    # URL to fakes server which represents some 3rd party which are mocked on external infrastructure
    base_url_host = 'https://chainlink-$product_name-fake:9111'

[[blockchains]]
  # One or more blockchains
  [blockchains.out]
    type = 'anvil'
    family = 'evm'
    chain_id = '1337'
    # One or more blockchain nodes
    [[blockchains.out.nodes]]
      ws_url = 'wss://blockchain-node-1:8545'
      http_url = 'https://blockchain-node-1:8545'

# One or more DON clusters
[[nodesets]]
  name = 'my-external-don-1'
  nodes = 2
  # Nodeset config output
  [nodesets.out]
    # First CL node connection data
    [[nodesets.out.cl_nodes]]
      [nodesets.out.cl_nodes.node]
        api_auth_user = 'some_user'
        api_auth_password = 'some_password'
        url = 'https://chainlink-node-1:6688'
      [nodesets.out.cl_nodes.postgresql]
        url = 'postgresql://chainlink:thispasswordislongenough@chainlink-node-1-db:13000/db_0?sslmode=disable'
    # Second node, etc..
    [[nodesets.out.cl_nodes]]
      [nodesets.out.cl_nodes.node]
        api_auth_user = 'some_user'
        api_auth_password = 'some_password'
        url = 'https://chainlink-node-2:6688'
      [nodesets.out.cl_nodes.postgresql]
        url = 'postgresql://chainlink:thispasswordislongenough@chainlink-node-2-db:13000/db_1?sslmode=disable'

# Second NodeSet, etc..
[[nodesets]]
  name = 'my-external-don-2'
  nodes = 2
  # All the other fields as in previous example above
Deploy the infrastructure first, then use up env-stage-1.toml to orchestrate staging environment.
In case your product has more infrastructure components define TOML keys [[my_custom_component]] and provide all the required connection data, use the same config structure you are using in your local environment, read more here
Extending a Generated Environment (AGENTS.md)
Every environment generated by ctf gen env ships an AGENTS.md file at its root that teaches
AI coding agents how the environment is structured and how to extend it following the existing
patterns.
This page reproduces that guide for reference — useful if your environment was generated before
AGENTS.md was added, or if you just want to read it here. Names below use the generator defaults
(pcli for the CLI, myproduct for the product); substitute your own if you chose different ones.
If you work with an AI agent, point it at
devenv/AGENTS.md. If that file is missing (older environment), copy the content below intodevenv/AGENTS.md, replacingpcli/myproductwith your CLI and product names.
A generated Chainlink developer environment composes Docker containers (blockchains, CL node sets,
fakes, custom services) and exposes an interactive CLI called pcli with autocompletion. Keep
changes minimal and idiomatic.
Layout
| Path | What it is |
|---|---|
cmd/pcli/pcli.go | CLI commands (cobra). Add commands here. |
cmd/pcli/completion.go | Shell autocompletion suggestions. Mirror every CLI command here. |
environment.go | Wiring: reads Cfg from TOML, spins up all Docker components in order. |
services/svc.go | Template for a custom Docker component (container). Copy this to add services. |
products/myproduct/configurator.go | Product logic: CL node configs, secrets, jobs & contracts. |
products/myproduct/*.toml | Product config profiles (basic.toml, soak.toml). |
fakes/main.go | HTTP fakes for 3rd-party dependencies (separate Docker image + go.mod). |
tests/myproduct/{func,perf}_test.go | System-level functional / performance (WASP) tests. |
env.toml | Default environment config: blockchains, nodesets, services, products. |
Justfile | Build recipes: just cli, just build-fakes. |
dashboards/myproduct.json | Grafana dashboard, auto-uploaded on up. |
Build & run
just cli          # rebuild the pcli binary after editing cmd/pcli/*
pcli sh           # enter the interactive shell (autocompletion)
up                # spin up env (inside shell); or: pcli up
test func         # run functional tests; test perf for performance
Config is selected via the CTF_CONFIGS env var, a comma-separated list of TOML files
(e.g. env.toml,products/myproduct/basic.toml). up/restart set this for you.
Add a CLI command
Commands are cobra commands in cmd/pcli/pcli.go.
- Declare a
*cobra.Commandvar withUse,Aliases,Short, and aRunEfunc. - Register it in
init()withrootCmd.AddCommand(myCmd)(orparent.AddCommand(child)for subcommands; set flags viaparent.PersistentFlags()— seebsCmd/obsCmd). - Always add a matching entry in
cmd/pcli/completion.go:- top-level command → add to
getCommands() - subcommands/args → add a
case "<cmd>":ingetSubCommands()
- top-level command → add to
just clito rebuild.
Business logic lives in the framework package (e.g. framework.ObservabilityUp(),
framework.BlockScoutUp()); the CLI is a thin wrapper. Prefer reusing framework helpers.
Wire up a new Docker component (service)
- Copy
services/svc.gotoservices/<name>.go. Each service = anInputstruct (withDefault()), anOutputstruct (with anoutTOML tag), and aNew<Name>(in)deploy func usingtestcontainers. Useframework.DefaultTCLabels(),framework.DefaultNetworkName, and static host ports. - Add the input field to the
Cfgstruct inenvironment.go(with atomltag). - Call
New<Name>(in.<Field>)insideNewEnvironment(), alongsideservices.NewService. - Add its config block to
env.toml. - A deployed service must guard on
in == nil || in.Out != nilto stay idempotent (seeNewService).
Add a product
- Copy
products/myproduct/→products/<newproduct>/andtests/myproduct/→tests/<newproduct>/. - Implement the
Productinterface (interface.go) inconfigurator.go:Load,Store,GenerateNodesConfig,GenerateNodesSecrets,ConfigureJobsAndContracts. - Register it in
newProduct(name)inenvironment.gowith a newcase. - Add a
[[products]]entry (withname,instances) inenv.toml. Multiple instances → yourConfigureJobsAndContractsmust handleproductIdx.
Add / change fakes (3rd-party HTTP)
Edit fakes/main.go (its own Docker image + go.mod), then just build-fakes.
Tests reach fakes via the fake_server output; see tests/myproduct/func_test.go.
Conventions (do not break)
- Docker components: static ports,
framework.DefaultTCLabels(),framework.DefaultNetworkName. - Config is TOML-driven; every new component/product needs a
Cfg/env.tomlentry. - Idempotent deploys: skip if output already set.
- Every CLI command has a completion entry.
- Address any
// TODOcomments the generator left before shipping.
🚀 Getting started
Prerequisites
Tested with
Docker Desktop version 4.36.0
Docker version 27.3.1
Test setup
To start writing tests create a directory for your project with go.mod and add a package
go get github.com/smartcontractkit/chainlink-testing-framework/framework
Download our CLI
OS X arm64 (M1/M2/M3 MacBooks)
curl -L https://github.com/smartcontractkit/chainlink-testing-framework/releases/download/framework%2Fv0.16.9/framework-v0.16.9-darwin-arm64.tar.gz | tar -xz
OS X amd64 (old Intel chips)
curl -L https://github.com/smartcontractkit/chainlink-testing-framework/releases/download/framework%2Fv0.16.9/framework-v0.16.9-darwin-amd64.tar.gz | tar -xz
Linux arm64
curl -L https://github.com/smartcontractkit/chainlink-testing-framework/releases/download/framework%2Fv0.16.9/framework-v0.16.9-linux-arm64.tar.gz | tar -xz
Linux amd64
curl -L https://github.com/smartcontractkit/chainlink-testing-framework/releases/download/framework%2Fv0.16.9/framework-v0.16.9-linux-amd64.tar.gz | tar -xz
Allow it to run in System Settings -> Security Settings (OS X)
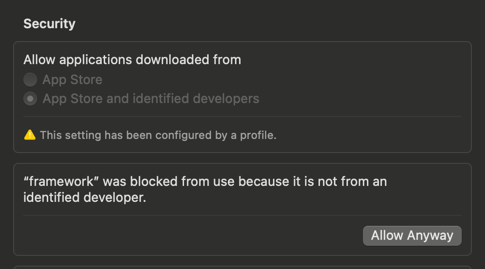
Create an .envrc file and do source .envrc (we recommend to use direnv, so you don't need to load it every time)
export TESTCONTAINERS_RYUK_DISABLED=true # do not remove containers while we develop locally
Now you are ready to write your first test
Tools setup (Optional)
This setup is optional, and it explains how to create a local observability stack for on-chain and off-chain components.
Spin up your local obserability stack (Grafana LGTM)
ctf obs up
More docs
Spin up your Blockscout stack
ctf bs up
More docs
🚀 Getting started
Prerequisites
Tested with
Docker Desktop version 4.36.0
Docker version 27.3.1
Test setup
To start writing tests create a directory for your project with go.mod and add a package
go get github.com/smartcontractkit/chainlink-testing-framework/framework
Download our CLI
OS X arm64 (M1/M2/M3 MacBooks)
curl -L https://github.com/smartcontractkit/chainlink-testing-framework/releases/download/framework%2Fv0.16.9/framework-v0.16.9-darwin-arm64.tar.gz | tar -xz
OS X amd64 (old Intel chips)
curl -L https://github.com/smartcontractkit/chainlink-testing-framework/releases/download/framework%2Fv0.16.9/framework-v0.16.9-darwin-amd64.tar.gz | tar -xz
Linux arm64
curl -L https://github.com/smartcontractkit/chainlink-testing-framework/releases/download/framework%2Fv0.16.9/framework-v0.16.9-linux-arm64.tar.gz | tar -xz
Linux amd64
curl -L https://github.com/smartcontractkit/chainlink-testing-framework/releases/download/framework%2Fv0.16.9/framework-v0.16.9-linux-amd64.tar.gz | tar -xz
Allow it to run in System Settings -> Security Settings (OS X)
Create an .envrc file and do source .envrc (we recommend to use direnv, so you don't need to load it every time)
export TESTCONTAINERS_RYUK_DISABLED=true # do not remove containers while we develop locally
Now you are ready to write your first test
Tools setup (Optional)
This setup is optional, and it explains how to create a local observability stack for on-chain and off-chain components.
Spin up your local obserability stack (Grafana LGTM)
ctf obs up
More docs
Spin up your Blockscout stack
ctf bs up
More docs
CLI
To keep documentation simple we provide CLI docs in "help" format
ctf -h
Configuration
Environment variables
| Name | Description | Possible values | Default | Required? |
|---|---|---|---|---|
| TESTCONTAINERS_RYUK_DISABLED | Testcontainers-Go reaper container, removes all the containers after the test exit | true, false | false | 🚫 |
| CTF_CONFIGS | Path(s) to test config files. Can be more than one, ex.: smoke.toml,smoke_1.toml,smoke_2.toml. First filepath will hold all the merged values | Any valid TOML file path | - | ✅ |
| CTF_LOG_LEVEL | Harness log level | info, debug, trace | info | 🚫 |
| CTF_PROMTAIL_DEBUG | Set true if you are integrating with remote Loki push API to debug Promtail | true, false | false | 🚫 |
| CTF_IGNORE_CRITICAL_LOGS | Ignore all logs that has CRIT,FATAL or PANIC levels (Chainlink nodes only!) | true, false | false | 🚫 |
| CTF_CHAINLINK_IMAGE | Flag to override Chainlink Docker image in format $repository:$tag | $repository:$tag | - | 🚫 |
| CTF_JD_IMAGE | Job distributor service image in format $repository:$tag | $repository:$tag | - | 🚫 |
| CTF_CLNODE_DLV | Use debug entrypoint to allow Delve debugger connection, works only with "plugins" image of CL node | true, false | false | 🚫 |
| LOKI_URL | URL to Loki push api, should be like${host}/loki/api/v1/push | URL | http://host.docker.internal:3030/loki/api/v1/push | 🚫 |
| LOKI_TENANT_ID | Streams all components logs to Loki, see params below | string | promtail | 🚫 |
| LOKI_BASIC_AUTH | Basic auth in format $user:$password | $user:$password | - | 🚫 |
| RESTY_DEBUG | Log all Resty client HTTP calls | true, false | false | 🚫 |
Debugging Tests
All container logs are saved in a directory named logs, which will appear in the same directory where you ran the test after the test is completed.
For verifying your on-chain components, refer to the Blockscout documentation on smart contract verification. This guide provides detailed instructions on uploading your ABI and verifying your contracts.
Use CTF_LOG_LEVEL=trace|debug|info|warn to debug the framework.
Use RESTY_DEBUG=true to debug any API calls.
Use SETH_LOG_LEVEL=trace|debug|info|warn to debug Seth.
Using Delve Debugger
If you are using Chainlink image with Delve available in path you can use ports 40000..400XX to connect to any node.
Developing Components
To build a scalable framework that enables the reuse of our product deployments (contracts or services in Docker), we need to establish a clear component structure.
package mycomponent

import (
	"fmt"
	"github.com/smartcontractkit/chainlink-testing-framework/framework"
)

type Input struct {
    // inputs fields that component exposes for configuration
    ...
    // outputs are embedded into inputs so framework can automatically save them
	Out                      *Output  `toml:"out"`
}

type Output struct {
    UseCache bool             `toml:"use_cache"`
    // outputs that will be dumped to config and cached
}


func NewComponent(input *Input) (*Output, error) {
	if input.Out != nil && input.Out.UseCache {
		return input.Out, nil
	}

	// component logic here
	// deploy a docker container(s)
	// or deploy a set of smart contracts

	input.Out = &Output{
	    UseCache: true,
	    // other fields
	    ...
	}
	return out, nil
}
Each component can define inputs and outputs, following these rules:
- Outputs should be included within inputs.
- If your component is used for side effects output can be omitted.
input.Out.UseCacheshould be added if you'd like to use caching, see more here
Building Local Images
Use framework.BuildImage or framework.BuildImageOnce to build the docker image.
Do not use testcontainers.NewDockerProvider() methods, see issues: #1, #2
Docker components good practices for testcontainers-go:
- Inputs should include at least
image,tagandpull_imagefield
	Image                string `toml:"image" validate:"required"`
	Tag                  string `toml:"tag" validate:"required"`
	PullImage            bool   `toml:"pull_image" validate:"required"`
ContainerRequestmust contain labels, network and alias required for local observability stack and deployment isolation
		Labels:   framework.DefaultTCLabels(),
		Networks: []string{framework.DefaultNetworkName},
		NetworkAliases: map[string][]string{
			framework.DefaultNetworkName: {containerName},
		},
- In order to copy files into container use
framework.WriteTmpFile(data string, fileName string)
	userSecretsOverridesFile, err := WriteTmpFile(in.Node.UserSecretsOverrides, "user-secrets-overrides.toml")
	if err != nil {
		return nil, err
	}
- Output of docker component must contain all the URLs component exposes for access, both for internal docker usage and external test (host) usage
	host, err := framework.GetHost(c)
	if err != nil {
		return nil, err
	}
	mp, err := c.MappedPort(ctx, nat.Port(bindPort))
	if err != nil {
		return nil, err
	}

	return &NodeOut{
	    UseCache: true,
		InternalURL: fmt.Sprintf("http://%s:%s", containerName, in.Node.Port),
		ExternalURL:   fmt.Sprintf("http://%s:%s", host, mp.Port()),
	}, nil
An example simple component
An example of complex component
An example of composite component
Exposing Components (Data and ports)
We use static port ranges and volumes for all components to simplify Docker port management for developers.
This approach allows us to apply chaos testing to any container, ensuring it reconnects and retains the data needed for your tests.
When deploying a component, you can explicitly configure port ranges if the default ports don’t meet your needs.
Defaults are:
- NodeSet (Node HTTP API):
10000..100XX - NodeSet (Node P2P API):
12000..120XX - NodeSet (Delve debugger):
40000..400XX(if you are using debug image) - Shared
PostgreSQLvolume is calledpostgresql_data
[[nodesets]]
  # HTTP API port range start, each new node get port incremented (host machine)
  http_port_range_start = 10000
  # P2P API port range start, each new node get port incremented (host machine)
  p2p_port_range_start = 12000
- PostgreSQL:
13000(we do not allow to have multiple databases for now, for simplicity)
    [nodesets.node_specs.db]
      # PostgreSQL volume name
      volume_name = "a"
      # PostgreSQL port (host machine)
      port = 13000
When you run ctf d rm database volume will be removed.
One node set is enough for any kind of testing, if you need more nodes consider extending your existing node set:
[[nodesets]]
  nodes = 10
Custom ports
You can also define a custom set of ports for any node.
[[nodesets]]
  name = "don"
  nodes = 5
  override_mode = "each"

  [nodesets.db]
    image = "postgres:12.0"

  [[nodesets.node_specs]]

    [nodesets.node_specs.node]
      # here we defined 2 new ports to listen and mapped them to our host machine
      # syntax is "host:docker"
      custom_ports = ["14000:15000"]
      image = "public.ecr.aws/chainlink/chainlink:v2.16.0"
Asserting Container Logs
Use built-in critical-level assertion (CRIT|PANIC|FATAL) for Chainlink node logs:
in, err := framework.Load[Cfg](t)
require.NoError(t, err)
t.Cleanup(func() {
	err := framework.SaveAndCheckLogs(t)
	require.NoError(t, err)
})
For custom checks, assert logs directly from streams with StreamCTFContainerLogsFanout.
re := regexp.MustCompile(`name=HeadReporter version=\d+`)
t.Cleanup(func() {
	err := framework.StreamCTFContainerLogsFanout(
		framework.LogStreamConsumer{
			Name: "custom-regex-assert",
			Consume: func(logStreams map[string]io.ReadCloser) error {
				for name, stream := range logStreams {
					scanner := bufio.NewScanner(stream)
					found := false
					for scanner.Scan() {
						if re.MatchString(scanner.Text()) {
							found = true
							break
						}
					}
					if err := scanner.Err(); err != nil {
						return fmt.Errorf("scan %s: %w", name, err)
					}
					if !found {
						return fmt.Errorf("missing HeadReporter log in %s", name)
					}
				}
				return nil
			},
		},
	)
	require.NoError(t, err)
})
Full example
Quick Contracts Deployment
You can control the mining pace to accelerate contract deployment. Start anvil with the following configuration:
[blockchain_a]
  type = "anvil"
Set the miner speed,
	// start periodic mining so nodes can receive heads (async)
	miner := rpc.NewRemoteAnvilMiner(bcSrc.Nodes[0].ExternalHTTPUrl, nil)
	miner.MinePeriodically(5 * time.Second)
Then use this template
Verifying Contracts
Using Foundry
You need to install Foundry first, forge should be available in your $PATH.
Check out our example of programmatically verifying contracts using Blockscout and Foundry. You'll need to provide:
- The path to your Foundry directory
- The path to the contract
- The contract name
		err := blockchain.VerifyContract(blockchainComponentOutput, c.Addresses[0].String(),
			"example_components/onchain",
			"src/Counter.sol",
			"Counter",
            "0.8.20" // check your file compiler version on the first line
		)
		require.NoError(t, err)
Using Seth
If you don't want to verify contracts or you can't or don't want to use Blockscout not all is lost.
With CLI
You can use Seth to trace your transaction both from your Go code or from the CLI. Remember that you need to adjust seth.toml to point to gethwrappers or ABIs of contracts you want to trace.
Programmatic
If you want to use from Go code, you need to have a couple of things in mind:
- you need to point Seth to your Gethwrappers, so that it can extract ABIs from them
- you need to decide, when it should trace transactions: reverted, none or all (by default, only reverted ones are traced)
- you need to decide, where to output tracing results: console, dot graphs, json files (be default, to console)
If printing to console remember to set Seth log level to debug, otherwise you won't see anything relevant printed:
client, err := NewClientBuilder().
    WithNetworkName("my network").
    WithRpcUrl("ws://localhost:8546").
    WithPrivateKeys([]string{"ac0974bec39a17e36ba4a6b4d238ff944bacb478cbed5efcae784d7bf4f2ff80"}).
    // tracing
    WithTracing(seth.TracingLevel_All, []string{seth.TraceOutput_Console}).
    // folder with gethwrappers for ABI decoding
    WithGethWrappersFolders([]string{"./gethwrappers/ccip", "./gethwrappers/keystone"}).
    Build()

if err != nil {
    log.Fatal(err)
}
For more information about configuring Seth please read about TOML config and programmatic builder.
CL Node Keys Import
If your tests are designed to run not just within a Docker environment but also with external infrastructure, and you want to reuse the test logic across different environments or securely store private keys, refer to the example below.
Test Configuration
Since end-to-end system-level test configurations can become complex, we use a single, generic method to marshal any configuration.
Here’s an example of how you can extend your configuration.
type Cfg struct {
    // Usually you'll have basic components
	BlockchainA        *blockchain.Input `toml:"blockchain_a" validate:"required"`
	MockerDataProvider *fake.Input       `toml:"data_provider" validate:"required"`
	NodeSet            *ns.Input         `toml:"nodeset" validate:"required"`
    // And some custom test-related data
    MyCustomTestData   string            `toml:"my_custom_test_data" validate:"required"`
}

func TestSmoke(t *testing.T) {
    in, err := framework.Load[Cfg](t)
    require.NoError(t, err)
    in.MyCustomTestData // do something
    ...
}
We use validator to make sure anyone can properly configure your test.
All basic components configuration is described in our docs, but it’s recommended to comment on your configuration in TOML.
Additionally, use validate:"required" or validate:"required,oneof=anvil geth" for fields with strict value options on your custom configuration.
# My custom config does X
[MyCustomConfig]
# Can be a number
a = 1
# Can be Y or Z
b = "Z"
Overriding Test Configuration
To override any test configuration, we merge multiple files into a single struct.
You can specify multiple file paths using CTF_CONFIGS=path1,path2,path3.
The framework will apply these configurations from right to left and marshal them to a single test config structure.
Use it to structure the variations of your test, ex.:
export CTF_CONFIGS=smoke-test-feature-a-simulated-network.toml
export CTF_CONFIGS=smoke-test-feature-a-simulated-network.toml,smoke-test-feature-a-testnet.toml

export CTF_CONFIGS=smoke-test-feature-a.toml
export CTF_CONFIGS=smoke-test-feature-a.toml,smoke-test-feature-b.toml

export CTF_CONFIGS=load-profile-api-service-1.toml
export CTF_CONFIGS=load-profile-api-service-1.toml,load-profile-api-service-2.toml
This helps reduce duplication in the configuration.
note
We designed overrides to be as simple as possible, as frameworks like envconfig and viper offer extensive flexibility but can lead to inconsistent configurations prone to drift.
This feature is meant to override test setup configurations, not test logic. Avoid using TOML to alter test logic.
Tests should remain straightforward, readable, and perform a single set of actions (potentially across different CI/CD environments). If variations in test logic are required, consider splitting them into separate tests.
warning
When override slices remember that you should replace the full slice, it won't be extended by default!
Overriding Components Configuration
The same override logic applies across components, files, and configuration fields in code, configs are applied in order:
- Implicit component defaults that are defined inside application
- Component defaults defined in the framework or external component, ex.: CLNode
Test.*Overrideuser_.*_overrides
Use Test.*Override in test code to override component configurations, and user_.*_overrides in TOML for the same purpose.
Components Cleanup
Managing state is challenging, especially in end-to-end testing, we use ryuk and following simple rules:
-
If
TESTCONTAINERS_RYUK_DISABLED=true, no cleanup occurs — containers, volumes, and networks remain on your machine.Feel free to use
ctf d rmto remove containers when you are ready. -
If
TESTCONTAINERS_RYUK_DISABLEDis unset, the test environment will be automatically cleaned up a few seconds after the test completes.
Keep in mind that all components are mapped to static ports, so without cleanup, only one environment can run at a time.
This design choice simplifies debugging.
A simplified command is available to prune unused volumes, containers, and build caches. Use it when you’re running low on space on your machine.
ctf d c
The framework manages cleanup for both on-chain and off-chain Docker components. However, if your test involves actions like configuring Chainlink jobs, it's best practice to make these actions idempotent, so they can be applied reliably in any environment.
Component caching
We use component caching to accelerate test development and enforce idempotent test actions development.
Each component is isolated by means of inputs and outputs.
If cached config has any outputs with use_cache = true it will be used instead of deploying a component again.
export CTF_CONFIGS=smoke-cache.toml
Components Resources
You can use resources to limit containers CPU/Memory for NodeSet, Blockchain and PostgreSQL components.
[blockchain_a.resources]
cpus = 0.5
memory_mb = 1048

[nodeset.db.resources]
cpus = 2
memory_mb = 2048

[nodeset.node_specs.node.resources]
cpus = 1
memory_mb = 1048
Read more about resource constraints here.
We are using cpu-period and cpu-quota for simplicity, and because it's working with an arbitrary amount of containers, it is absolute.
How quota and period works:
- To allocate
1 CPU, we setCPUQuota = 100000andCPUPeriod = 100000(1 full period). - To allocate
0.5 CPU, we setCPUQuota = 50000andCPUPeriod = 100000. - To allocate
2 CPUs, we setCPUQuota = 200000andCPUPeriod = 100000.
Read more about CFS.
When the resources.memory_mb key is not empty, we disable swap, ensuring the container goes OOM when memory is exhausted, allowing for more precise detection of sudden memory spikes.
Full configuration example
Containers Network Isolation
Some components can be isolated from internet. Since some of them doesn't have iptables and must be accessible from local host for debugging we isolate network on DNS level.
JobDistributor is isolated from internet by default to prevent applying manifest changes when run in tests.
NodeSet DNS isolation can be controlled with a flag
[[nodesets]]
  # NodeSet DNS can be isolated if needed
  no_dns = true
Fake Services
The framework aims to equip you with all the necessary tools to write end-to-end system-level tests, while still allowing the flexibility to fake third-party services that are not critical to your testing scope.
Local Usage without Docker (Go runtime)
[fake]
  # port to start Gin server
  port = 9111
See full example.
Run it
CTF_CONFIGS=fake.toml go test -v -run TestFakes
host.docker.internal is Docker platform dependent!
Use framework.HostDockerInternal() to reference host.docker.internal in your tests, so they can work in GHA CI
Dockerized Usage
Copy this example into your project, write the logic of fake using fake.JSON and fake.Func, build and upload it and run.
Install
To handle some utility command please install Taskfile
brew install go-task
Private Repositories (Optional)
If your tests are in a private repository please generate a new SSH key and add it on GitHub. Don't forget to click Configure SSO in UI
task new-ssh
Usage
Build it and run locally when developing fakes
task build -- ${product-name}-${tag} # ex. myproduct-1.0
task run
Test it
curl "http://localhost:9111/static-fake"
curl "http://localhost:9111/dynamic-fake"
Publish it
task publish -- $tag
See full example
Run it
[fake]
  # the image you've built
  image = "test-fakes:myproduct-1.0"
  # port for Gin server
  port = 9111
CTF_CONFIGS=fake_docker.toml go test -v -run TestDockerFakes
Resource Leak Detector
We have a simple utility to detect resource leaks in our tests
CL Nodes Leak Detection
In this example test will fail if any node will consume more than 2 additional cores and allocate 20% more memory at the end of a test.
import (
	"github.com/smartcontractkit/chainlink-testing-framework/framework/leak"
)
			l, err := leak.NewCLNodesLeakDetector(leak.NewResourceLeakChecker())
			require.NoError(t, err)
			errs := l.Check(&leak.CLNodesCheck{
				NumNodes:        in.NodeSets[0].Nodes,
				Start:           start,
				End:             time.Now(),
				WarmUpDuration:  10 * time.Minute,
				CPUThreshold:    2000.0,
				MemoryThreshold: 20.0,
			})
			require.NoError(t, errs)
Custom Resource Assertion
You can also use low-level API to verify
		diff, err := lc.MeasureDelta(&leak.CheckConfig{
			Query:          fmt.Sprintf(`quantile_over_time(0.5, container_memory_rss{name="don-node%d"}[1h]) / 1024 / 1024`, i),
			Start:          mustTime("2026-01-12T21:53:00Z"),
			End:            mustTime("2026-01-13T10:11:00Z"),
			WarmUpDuration: 1 * time.Hour,
		})
		require.NoError(t, err)
Adding New Queries
You can use our test hog to debug new metrics and verify its correctness
cd framework/leak/cmd
just build
Run different hogs
ctf obs up
go test -v -timeout 1h -run TestCyclicHog
Then verify your query
go test -v -run TestVerifyCyclicHog
Compatibility Testing
Compatibility testing verifies that your product remains functional when Chainlink nodes are upgraded from older versions to new ones. The ctf compat backward command automates this process: it rolls back to an older version, boots the environment, runs your tests, then upgrades nodes one step at a time — re-running tests after each upgrade — until the latest version is validated.
How the Upgrade Process Works
1. Select a version sequence  (e.g. v2.32.0 → v2.33.0 → v2.34.0)
2. Check out the oldest Git tag  (so environment + test code match that release)
3. Boot environment with the oldest image  →  run tests  (baseline)
4. For each next version:
     a. Pull the new Docker image
     b. Upgrade N nodes  (stop container, swap image, restart — node DB volumes preserved)
     c. Run tests again  (mixed-version cluster)
5. Repeat until the latest version is fully deployed and tested
Each step preserves the database volumes so node state is carried forward, exactly as it would be in a real rolling upgrade.
Golden Path: Enabling Compatibility Tests in Your Repository
Step 1 — Create an IAM Role for ECR Access
Your GitHub Actions runner needs permission to pull Chainlink node and Job Distributor (JD) images from AWS ECR.
Request the role from your infra team. The role should follow the pattern used in gha-smartcontractkit and grant:
ecr-public:GetAuthorizationTokenonus-east-1(public ECR, for CL images)ecr:GetAuthorizationToken+ecr:BatchGetImage+ecr:GetDownloadUrlForLayeronus-west-2(private ECR, for JD images)
Step 2 — Add GitHub Actions Secrets
Add the following secrets to your repository (Settings → Secrets and variables → Actions):
| Secret name | Description | Example value |
|---|---|---|
PRODUCT_IAM_ROLE | ARN of the IAM role that grants ECR pull access. Name it with your product name, for example CCV_IAM_ROLE | arn:aws:iam::<account_id>:role/gha-smartcontractkit-<repo> |
JD_REGISTRY | Private ECR registry ID for JD images | <production_ecr_registry_number>.dkr.ecr.us-west-2.amazonaws.com |
JD_IMAGE | Full JD image reference (used by your environment config) | <production_ecr_registry_number>.dkr.ecr.us-west-2.amazonaws.com/job-distributor:0.22.1 |
Using the GitHub CLI:
gh secret set PRODUCT_IAM_ROLE   # paste the IAM role ARN
gh secret set JD_REGISTRY    # paste the JD registry URL
gh secret set JD_IMAGE       # paste the JD image reference
Step 3 — Copy the Compat Pipeline
Copy devenv-compat.yml from chainlink into your repository at .github/workflows/devenv-compat.yml.
The workflow performs the following on each run:
- name: Checkout code
  uses: actions/checkout@v5
  with:
    fetch-depth: 0          # required: ctf reads all git tags

- name: Authenticate to AWS ECR
  uses: ./.github/actions/aws-ecr-auth
  with:
    role-to-assume: ${{ secrets.PRODUCT_IAM_ROLE }}
    aws-region: us-east-1
    registry-type: public

- name: Authenticate to AWS ECR (JD)
  uses: ./.github/actions/aws-ecr-auth
  with:
    role-to-assume: ${{ secrets.PRODUCT_IAM_ROLE }}
    aws-region: us-west-2
    registry-type: private
    registries: ${{ secrets.JD_REGISTRY }}

- name: Run compatibility test
  run: |
    ctf compat backward \
      --registry <your_ecr_registry>/chainlink \
      --buildcmd "just cli" \
      --envcmd "mycli r env.toml,products/myproduct/basic.toml" \
      --testcmd "mycli test myproduct TestSmoke/rounds" \
      --strip-image-suffix v \
      --upgrade-nodes 2 \
      --versions-back 3
fetch-depth: 0 is required because ctf reads all Git tags to build the version sequence.
Step 4 — Add a Nightly Trigger
Compatibility tests are typically run on a nightly schedule rather than on every PR. Add a nightly workflow that points to your product configuration:
See the chainlink nightly example for a complete reference.
Step 5 — Write Your Compatibility Tests
Your tests are plain Go tests invoked via the --testcmd argument. They must:
- Connect to the already-running environment (do not spin up new nodes inside the test)
- Exercise the behaviour that must remain functional across versions
- Be runnable at the oldest supported version AND at every intermediate mixed-version state
A minimal example for DF1:
The test command passed to --testcmd is an arbitrary shell command, so you can target any subset of tests:
Running the Upgrade Sequence Locally
Before pushing to CI, authenticate to the SDLC ECR registry:
aws ecr get-login-password --region us-west-2 \
  | docker login --username AWS --password-stdin <sdlc_ecr_registry>
Install the ctf CLI if you haven't already — see Getting Started.
Explicit version list
Provide the exact versions to test in order from oldest to newest. The first ref must have a working test at that Git tag.
ctf compat backward \
  --registry <sdlc_ecr_registry> \
  --buildcmd "just cli" \
  --envcmd "mycli r env.toml" \
  --testcmd "mycli test myproduct TestSmoke/rounds" \
  --refs 2.32.0 \
  --refs 2.33.0 \
  --refs 2.34.0 \
  --refs 2.35.0 \
  --upgrade-nodes 3
Automatic SemVer detection (CI mode)
In CI, omit --refs and let ctf detect the last N SemVer tags automatically:
ctf compat backward \
  --registry <sdlc_ecr_chainlink_registry> \
  --buildcmd "just cli" \
  --envcmd "mycli r env.toml,products/myproduct/basic.toml" \
  --testcmd "mycli test myproduct TestSmoke/rounds" \
  --strip-image-suffix v \
  --upgrade-nodes 2 \
  --versions-back 3
When a new SemVer tag is pushed, the pipeline selects the last --versions-back tags, rolls back to the oldest, and runs the full upgrade sequence.
All ctf compat backward Flags
| Flag | Default | Description |
|---|---|---|
--registry | smartcontract/chainlink | Docker image registry for Chainlink nodes |
--refs | (none) | Explicit version list (oldest → newest). Repeat for each version. If omitted, SemVer tags are detected from git. |
--versions-back | 1 | How many previous SemVer tags to include when auto-detecting (used without --refs) |
--upgrade-nodes | 3 | Number of nodes to upgrade at each step |
--don_nodes | 5 | Total size of the DON (used with --product for SOT modelling) |
--buildcmd | just cli | Command to build the devenv CLI binary |
--envcmd | (required) | Command to start the environment |
--testcmd | (required) | Command to run the compatibility tests |
--node-name-template | don-node%d | Docker container name template for CL nodes. Use --node-name-template custom-cl-node-%d if your DON uses custom naming. |
--strip-image-suffix | (none) | Strip a prefix from refs before looking them up in the registry (e.g. v strips the leading v from v2.34.0) |
--include-refs | (none) | Only include refs matching these patterns (e.g. rc,beta) |
--exclude-refs | (none) | Exclude refs matching these patterns (e.g. rc,beta) |
--no-git-rollback | false | Skip checking out the oldest Git tag. Use when your tests don't live in the same repo as the node. |
--skip-pull | false | Skip docker pull; use locally cached images |
--product | (none) | Enable SOT DON modelling for this product name (see below) |
--sot-url | https://rane-sot-app.main.prod.cldev.sh/v1/snapshot | RANE SOT snapshot API URL |
--rane-add-git-tag-prefix | (none) | Prefix to add to RANE version strings to match Git tags |
Advanced: Modelling Real Node Operator DON Upgrades (WIP)
When --product is specified, ctf compat backward fetches the versions currently running on real DONs from the RANE SOT data source and models the upgrade sequence across actual node operator versions.
ctf compat backward \
  --registry <sdlc_ecr_chainlink_registry> \
  --buildcmd "just cli" \
  --envcmd "mycli r env.toml,products/myproduct/basic.toml" \
  --testcmd "mycli test myproduct TestSmoke/rounds" \
  --product data-feeds \
  --don_nodes 5
--product field is connected with jq .nodes[].jobs[].product field from SOT data, find your product name there.
--no-git-rollback can be added if your product orchestration code and tests are compatible with all these versions, otherwise, Git rollback will be performed automatically.
If SOT versions do not yet have corresponding Git tags or registry images, supply them explicitly with --refs:
ctf compat backward \
  --registry <sdlc_ecr_chainlink_registry> \
  --buildcmd "just cli" \
  --envcmd "mycli r env.toml,products/myproduct/basic.toml" \
  --testcmd "mycli test myproduct TestSmoke/rounds" \
  --product data-feeds \
  --refs "2.36.1-rc.0" \
  --refs "2.36.1-beta.0" \
  --refs "2.36.1-beta.2" \
  --refs "2.37.0-rc.0" \
  --refs "2.37.0-beta.0" \
  --refs "2.38.0-rc.0" \
  --refs "2.38.0-beta.0" \
  --no-git-rollback \
  --don_nodes 5
Restoring Your Working Branch After Testing
ctf compat backward checks out old Git tags during a run. To return to your working branch:
ctf compat restore --base_branch develop
# or just:
git checkout develop
Copying Files
You can copy files to containers by using the ContainerName from the output and specifying the source src and destination dst paths.
However, using this API is discouraged and will be deprecated in the future, as it violates the principles of "black-box" testing. If your service relies on this functionality, consider designing a configuration or API to address the requirement instead.
	bc, err := blockchain.NewBlockchainNetwork(&blockchain.Input{
	    ...
	})
	require.NoError(t, err)

	err = dockerClient.CopyFile(bc.ContainerName, "local_file.txt", "/home")
	require.NoError(t, err)
Running in Kubernetes
Set up Kubernetes context for main.stage and add namespace variable to run devenv:
kubectl config use-context staging-eks-admin
export KUBERNETES_NAMESPACE="devenv-1"
Each Pod always has a service, you can found programmatic connection data in .out.
To forward all the services locally use kubefwd
sudo -E kubefwd svc -n $KUBERNETES_NAMESPACE
Fork Testing
We verify our on-chain and off-chain changes using forks of various networks.
Go to example project dir to try the examples yourself.
On-chain Only
In this example, we:
- Create two
anvilnetworks, each targeting the desired network (change URLs andanvilsettings as required, see full anvil reference). - Connect two clients to the respective networks.
- Deploy two test contracts.
- Interact with the deployed contracts.
- Demonstrate interactions using the
anvilRPC client (more client methods examples are here)
Run it
CTF_CONFIGS=fork.toml go test -v -run TestFork
On-chain + Off-chain
The chain setup remains the same as in the previous example, but now we have 5 Chainlink nodes connected with 2 networks.
Run it
CTF_CONFIGS=fork_plus_offchain.toml go test -v -run TestOffChainAndFork
Be mindful of RPC rate limits, as your provider may enforce restrictions. Use docker_cmd_params field to configure appropriate rate limiting and retries with the following parameters:
--compute-units-per-second <CUPS>
--fork-retry-backoff <BACKOFF>
--retries <retries>
--timeout <timeout>
If the network imposes limits, the container will panic, triggering messages indicating that the container health check has failed.
Fork Testing (Mutating Storage)
We provide API to use anvil_setStorageAt more easily so in case you can't edit EVM smart contracts code you can still mutate your contract values.
You need to build your contract layout first
forge build || forge inspect Counter storageLayout --json > layout.json
And then you can use AnvilSetStorageAt to override contract's storage data
		r := rpc.New(rpcURL, nil)
		err = r.AnvilSetStorageAt([]interface{}{contractAddr, slot, data})
See examples of how you can use API to encode/mutate different values.
Keep in mind that values <32 bytes are packed together, see encodeCustomStructFunc example and offset example to understnad how to change them properly.
cd framework/evm_storage
./setup.sh
go test -v -run TestLayoutAPI
./teardown.sh
Read more about Solidity storage layout here
Local Observability Stack
You can use a local observability stack, framework is connected to it by default
Default mode includes:
- Prometheus
- Loki
- OTEL-collector
- Grafana
# start the observability stack
ctf obs up
# remove the stack with all the data (volumes)
ctf obs d
# restart the stack removing all the data (volumes)
ctf obs r
Full stack has all the services above but also adds:
- Cadvisor
- Tempo
- Pyroscope
- PostgreSQL exporters for NodeSet databases
# start the observability stack
ctf obs up -f
# remove the stack with all the data (volumes)
ctf obs d -f
# restart the stack removing all the data (volumes)
ctf obs r -f
Read more about how to check logs and profiles
Developing
Change compose files under framework/cmd/observability and restart the stack (removing volumes too)
just reload-cli && ctf obs r
Local Dashboards (Docker)
You can create a dashboard using UI and put them under $pwd/dashboards folder then commit, they'll be loaded automatically on start and you can find them here under local directory.
$pwd is you current working directory from which you call ctf obs u
Troubleshooting
cadvisor is not working
Make sure your Advanced Docker settings look like this
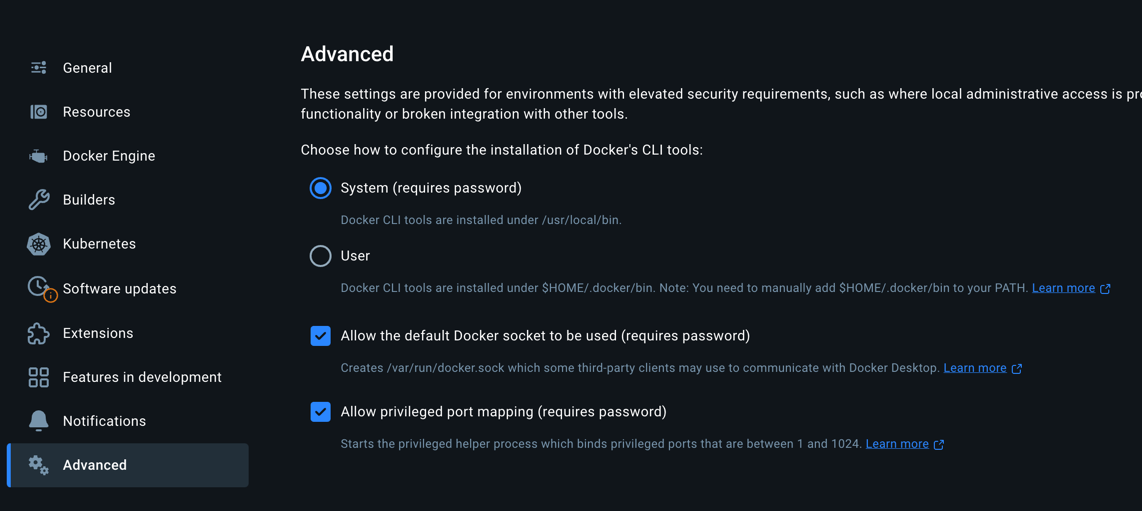
Metrics
We use Prometheus to collect metrics of Chainlink nodes and other services.
Check Prometheus UI.
Check Grafana example query.
Queries:
- All metrics of all containers
{job="ctf"}
Docker Resources
We are using cadvisor to monitor resources of test containers.
Cadvisor UI can be found here
Logs
We are using Loki for logging, check localhost:3000
Queries:
- Particular node logs
{job="ctf", container=~"node0"}
- All nodes logs
{job="ctf", container=~"node.*"}
- Filter by log level
{job="ctf", container=~"node.*"} |= "WARN|INFO|DEBUG"
Profiling
We are using Pyroscope for profiling.
Go to localhost:4040 and choose Chainlink application
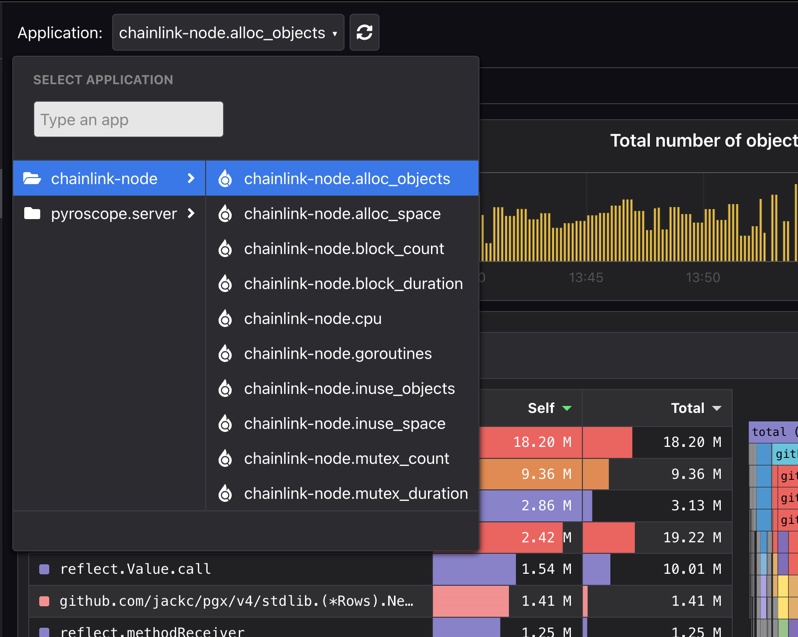
PostgreSQL
Metrics
You can go to this dashboard and select Instance.
We run exporter for the first 5 nodes, that should be enough to debug performance issues.
Data sources and raw queries
You can use PostgreSQL X datasources, first 5 nodes to select things for your dashboards or debug.
Slow queries debug
Use pg_stat_statements extension, it is enabled for all databases in NodeSet
select * from pg_stat_statements;
Blockscout
You can use local Blockscout instance to debug EVM smart contracts.
Some images require ghcr auth, login first and pass the token:
gh auth token | docker login ghcr.io -u github-username --password-stdin
Start Blockscout
ctf bs up
Your Blockscout instance is up on localhost
To remove it, we also clean up all Blockscout databases to prevent stale data when restarting your tests.
ctf bs down
Selecting Blockchain Node
By default, we connect to the first anvil node, but you can select the node explicitly
ctf bs -r http://host.docker.internal:8545 d
ctf bs -r http://host.docker.internal:8555 d
Blockscout isn’t ideal for local, ephemeral environments, as it won’t re-index blocks and transactions on test reruns. The easiest approach is to set up Blockscout first, initialize the test environment, switch to the cache config, and run tests without restarting RPC nodes.
Otherwise, use ctf bs r each time you restart your test with a fresh docker environment.
Local Observability Stack (VictoriaMetrics)
Minimal setup for experimenting with OTEL metrics & logs in Grafana.
Components
| Service | Port | Purpose |
|---|---|---|
| Grafana | 3000 | UI, anonymous admin enabled |
| OTEL Collector | 4317 (gRPC), 4318 (HTTP) | Receives OTLP from your app |
| VictoriaMetrics | 8428 | Metrics TSDB (Prom remote_write in, MetricsQL out) |
| VictoriaLogs | 9428 | Logs DB (OTLP in, LogsQL out) |
Run
# start the observability stack
ctf obs up -vm
# remove the stack with all the data (volumes)
ctf obs d -vm
# restart the stack removing all the data (volumes)
ctf obs r -vm
Developing
Change compose files under framework/cmd/observability and restart the stack (removing volumes too)
just reload-cli && ctf obs r
Local Dashboards (Docker)
You can create a dashboard using UI and put them under $pwd/dashboards folder then commit, they'll be loaded automatically on start and you can find them here under local directory.
$pwd is you current working directory from which you call ctf obs u
Logs
WASP load data is stored in VictoriaLogs and queried with LogsQL. The bundled WASP (VictoriaLogs) dashboard is loaded automatically, but you can also explore the raw data in localhost:3000 (VictoriaLogs datasource) or directly via the VictoriaLogs UI at localhost:9428.
Every WASP record carries these fields: go_test_name, gen_name, call_group, branch, commit and test_data_type (stats or responses). Numeric values (current_rps, current_instances, duration, ...) live in the JSON _msg, so add | unpack_json before aggregating them.
Example WASP Log Queries
Queries:
- All data for a single test
go_test_name:="TestMyLoad"
- Periodic generator stats (RPS, VUs, sampling)
go_test_name:="TestMyLoad" AND test_data_type:stats
- Individual responses (one log line per call)
go_test_name:="TestMyLoad" AND test_data_type:responses
- Current RPS per generator
test_data_type:stats | unpack_json | stats by (go_test_name, gen_name) max(current_rps) value
- Current VUs (virtual users) per generator
test_data_type:stats | unpack_json | stats by (go_test_name, gen_name) max(current_instances) value
- Failed responses
test_data_type:responses AND _msg:"\"failed\":true"
- Timed out responses
test_data_type:responses AND _msg:"\"timeout\":true"
- Latency quantiles (p99/p95/p50, in nanoseconds) per call group
test_data_type:responses | unpack_json | stats by (gen_name, call_group) quantile(0.99, duration) value
Components
CTF consists of two groups of components:
- Off-chain services like NodeSet
- Test components, blockchain simulators, fake server
Blockchain components
Here we keep blockchain simulators or real nodes we use for integration testing.
EVM Blockchain Clients
We support 3 EVM clients at the moment: Geth, Anvil and Besu
Configuration
[blockchain_a]
  # Blockchain node type, can be "anvil", "geth" or "besu
  type = "anvil"
  # Chain ID
  chain_id = "1337"
  # Anvil command line params, ex.: docker_cmd_params = ['--block-time=1', '...']
  docker_cmd_params = []
  # Docker image and tag
  image = "ghcr.io/foundry-rs/foundry:stable"
  # External port to expose (HTTP API)
  port = "8545"
  # External port to expose (WS API)
  port_ws = "8546"
  # Pulls the image every time if set to 'true', used like that in CI. Can be set to 'false' to speed up local runs
  pull_image = false

  # Outputs are the results of deploying a component that can be used by another component
  [blockchain_a.out]
    # If 'use_cache' equals 'true' we skip component setup when we run the test and return the outputs
    use_cache = true
    # Chain ID
    chain_id = "1337"
    # Chain family, "evm", "solana", "cosmos", "op", "arb"
    family = "evm"

    [[blockchain_a.out.nodes]]
      # URLs to access the node(s) inside docker network, used by other components
      internal_http_url = "http://anvil-14411:8545"
      internal_ws_url = "ws://anvil-14411:8545"
      # URLs to access the node(s) on your host machine or in CI
      http_url = "http://127.0.0.1:33955"
      ws_url = "ws://127.0.0.1:33955"
Usage
package my_test

import (
	"os"
	"testing"
	"github.com/smartcontractkit/chainlink-testing-framework/framework"
	"github.com/smartcontractkit/chainlink-testing-framework/framework/components/blockchain"
	"github.com/stretchr/testify/require"
)

type Config struct {
	BlockchainA        *blockchain.Input `toml:"blockchain_a" validate:"required"`
}

func TestDON(t *testing.T) {
	in, err := framework.Load[Config](t)
	require.NoError(t, err)

	// deploy anvil blockchain simulator
	bc, err := blockchain.NewBlockchainNetwork(in.BlockchainA)
	require.NoError(t, err)
}
Test Private Keys
For Geth we use
	DefaultGethPrivateKey = `ac0974bec39a17e36ba4a6b4d238ff944bacb478cbed5efcae784d7bf4f2ff80`
	DefaultGethPublicKey = `0xf39fd6e51aad88f6f4ce6ab8827279cfffb92266`
For Anvil we use
	DefaultAnvilPrivateKey = `ac0974bec39a17e36ba4a6b4d238ff944bacb478cbed5efcae784d7bf4f2ff80`
	AnvilPrivateKey1       = `0x59c6995e998f97a5a0044966f0945389dc9e86dae88c7a8412f4603b6b78690d`
	AnvilPrivateKey2       = `0x5de4111afa1a4b94908f83103eb1f1706367c2e68ca870fc3fb9a804cdab365a`
	AnvilPrivateKey3       = `0x7c852118294e51e653712a81e05800f419141751be58f605c371e15141b007a6`
	AnvilPrivateKey4       = `0x47e179ec197488593b187f80a00eb0da91f1b9d0b13f8733639f19c30a34926a`

	DefaultAnvilPublicKey  = `0xf39Fd6e51aad88F6F4ce6aB8827279cffFb92266`
	AnvilPublicKey1        = `0x70997970C51812dc3A010C7d01b50e0d17dc79C8`
	AnvilPublicKey2        = `0x3C44CdDdB6a900fa2b585dd299e03d12FA4293BC`
	AnvilPublicKey3        = `0x90F79bf6EB2c4f870365E785982E1f101E93b906`
	AnvilPublicKey4        = `0x15d34AAf54267DB7D7c367839AAf71A00a2C6A65`
For Besu keys are
	DefaultBesuPrivateKey1 = "8f2a55949038a9610f50fb23b5883af3b4ecb3c3bb792cbcefbd1542c692be63"
	DefaultBesuPrivateKey2 = "c87509a1c067bbde78beb793e6fa76530b6382a4c0241e5e4a9ec0a0f44dc0d3"
	DefaultBesuPrivateKey3 = "ae6ae8e5ccbfb04590405997ee2d52d2b330726137b875053c36d94e974d162f"

	DefaultBesuPublicKey1 = "0xfe3b557e8fb62b89f4916b721be55ceb828dbd73"
	DefaultBesuPublicKey2 = "0x627306090abaB3A6e1400e9345bC60c78a8BEf57"
	DefaultBesuPublicKey3 = "0xf17f52151EbEF6C7334FAD080c5704D77216b732"
More docs for Besu can be found here
Solana Blockchain Client
Since Solana doesn't have official image for arm64 we built it, images we use are:
amd64 solanalabs/solana:v1.18.26
arm64 public.ecr.aws/w0i8p0z9/solana-validator:main-1dcdbc4
Configuration
[blockchain_a]
  type = "solana"
  # public key for mint
  public_key = "9n1pyVGGo6V4mpiSDMVay5As9NurEkY283wwRk1Kto2C"
  # contracts directory, programs
  contracts_dir = "."
  # optional, in case you need some custom image
  # image = "solanalabs/solana:v1.18.26"
  # you can add docker cmd params, for example to clone some contracts
  docker_cmd_params = ["--clone", "y9MdSjD9Beg9EFaeQGdMpESFWLNdSfZKQKeYLBfmnjJ", "-u", "https://api.mainnet-beta.solana.com"]


# optional
# To deploy a solana program, we can provide a mapping of program name to program id.
# The program name has to match the name of the .so file in the contracts_dir directory.
# This example assumes there is a mcm.so in the mounted contracts_dir directory
# value is the program_id to set for the deployed program, any valid public key can be used here.
# this allows lookup via program_id during testing.
# Alternative, we can use `solana deploy` instead of this field to deploy a program, but
# program_id will be auto generated.
[blockchain_a.solana_programs]
  mcm = "6UmMZr5MEqiKWD5jqTJd1WCR5kT8oZuFYBLJFi1o6GQX"
Usage
package examples

import (
	"context"
	"fmt"
	"github.com/blocto/solana-go-sdk/client"
	"github.com/smartcontractkit/chainlink-testing-framework/framework"
	"github.com/smartcontractkit/chainlink-testing-framework/framework/components/blockchain"
	"github.com/stretchr/testify/require"
	"testing"
)

type CfgSolana struct {
	BlockchainA *blockchain.Input `toml:"blockchain_a" validate:"required"`
}

func TestSolanaSmoke(t *testing.T) {
	in, err := framework.Load[CfgSolana](t)
	require.NoError(t, err)

	bc, err := blockchain.NewBlockchainNetwork(in.BlockchainA)
	require.NoError(t, err)

	t.Run("test something", func(t *testing.T) {
		// use internal URL to connect chainlink nodes
		_ = bc.Nodes[0].InternalHTTPUrl
		// use host URL to deploy contracts
		c := client.NewClient(bc.Nodes[0].ExternalHTTPUrl)
		latestSlot, err := c.GetSlotWithConfig(context.Background(), client.GetSlotConfig{Commitment: "processed"})
		require.NoError(t, err)
		fmt.Printf("Latest slot: %v\n", latestSlot)
	})
}
Test Private Keys
Public: 9n1pyVGGo6V4mpiSDMVay5As9NurEkY283wwRk1Kto2C
Private: [11,2,35,236,230,251,215,68,220,208,166,157,229,181,164,26,150,230,218,229,41,20,235,80,183,97,20,117,191,159,228,243,130,101,145,43,51,163,139,142,11,174,113,54,206,213,188,127,131,147,154,31,176,81,181,147,78,226,25,216,193,243,136,149]
Aptos Blockchain Client
You need to turn Rosetta off to use this image! Image doesn't work with OrbStack currently.
Docker Desktop
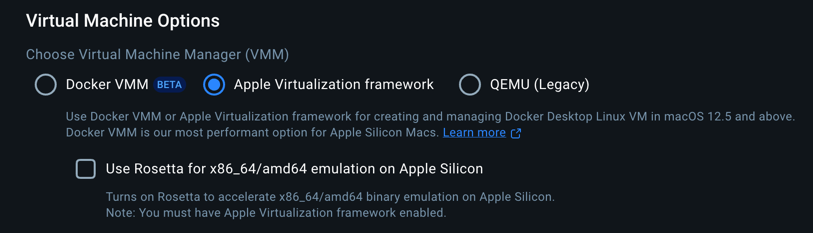
Default image is aptoslabs/tools:aptos-node-v1.18.0
API is available on localhost:8080
Configuration
[blockchain_a]
  type = "aptos"
  image = "aptoslabs/tools:aptos-node-v1.18.0" # or aptoslabs/tools:nightly
  contracts_dir = "$your_dir"
  # expose custom ports, by default 8080 is API and 8081 is faucet
  custom_ports = ["9080:8080", "9081:9081"]
  # add command params
  docker_cmd_params = ["--skip-metadata-apply"]
Usage
package examples

import (
	"github.com/go-resty/resty/v2"
	"github.com/smartcontractkit/chainlink-testing-framework/framework"
	"github.com/smartcontractkit/chainlink-testing-framework/framework/components/blockchain"
	"github.com/stretchr/testify/require"
	"testing"
)

type CfgAptos struct {
	BlockchainA *blockchain.Input `toml:"blockchain_a" validate:"required"`
}

func TestAptosSmoke(t *testing.T) {
	in, err := framework.Load[CfgAptos](t)
	require.NoError(t, err)

	bc, err := blockchain.NewBlockchainNetwork(in.BlockchainA)
	require.NoError(t, err)

	// execute any additional commands, to deploy contracts or set up
	// network is already funded, here are the keys
	_ = blockchain.DefaultAptosAccount
	_ = blockchain.DefaultAptosPrivateKey

	_, err = framework.ExecContainer(bc.ContainerName, []string{"ls", "-lah"})
	require.NoError(t, err)

	t.Run("test something", func(t *testing.T) {
		// use internal URL to connect Chainlink nodes
		_ = bc.Nodes[0].InternalHTTPUrl
		// use host URL to interact
		_ = bc.Nodes[0].ExternalHTTPUrl
		r := resty.New().SetBaseURL(bc.Nodes[0].ExternalHTTPUrl).EnableTrace()
		_, err := r.R().Get("/v1/transactions")
		require.NoError(t, err)
	})
}
Test Private Keys
Default account is already funded with 100000000 Octas
	Account: 0xa337b42bd0eecf8fb59ee5929ea4541904b3c35a642040223f3d26ab57f59d6e
	PrivateKey: 0xd477c65f88ed9e6d4ec6e2014755c3cfa3e0c44e521d0111a02868c5f04c41d4
Sui Blockchain Client
API is available on localhost:9000
Configuration
[blockchain_a]
  type = "sui"
  image = "mysten/sui-tools:mainnet" # if omitted default is mysten/sui-tools:devnet
  contracts_dir = "$your_dir"
  image_platform = "linux/amd64" # default one
Usage
package examples

import (
	"context"
	"fmt"
	"github.com/block-vision/sui-go-sdk/models"
	"github.com/block-vision/sui-go-sdk/signer"
	"github.com/block-vision/sui-go-sdk/sui"
	"github.com/smartcontractkit/chainlink-testing-framework/framework"
	"github.com/smartcontractkit/chainlink-testing-framework/framework/components/blockchain"
	"github.com/stretchr/testify/require"
	"testing"
)

type CfgSui struct {
	BlockchainA *blockchain.Input `toml:"blockchain_a" validate:"required"`
}

func TestSuiSmoke(t *testing.T) {
	in, err := framework.Load[CfgSui](t)
	require.NoError(t, err)

	bc, err := blockchain.NewBlockchainNetwork(in.BlockchainA)
	require.NoError(t, err)

	// network is already funded, here are the keys
	_ = bc.NetworkSpecificData.SuiAccount.Mnemonic
	_ = bc.NetworkSpecificData.SuiAccount.PublicBase64Key
	_ = bc.NetworkSpecificData.SuiAccount.SuiAddress

	// execute any additional commands, to deploy contracts or set up
	_, err = framework.ExecContainer(bc.ContainerName, []string{"ls", "-lah"})
	require.NoError(t, err)

	t.Run("test something", func(t *testing.T) {
		// use internal URL to connect Chainlink nodes
		_ = bc.Nodes[0].InternalHTTPUrl
		// use host URL to interact
		_ = bc.Nodes[0].ExternalHTTPUrl

		cli := sui.NewSuiClient(bc.Nodes[0].ExternalHTTPUrl)

		signerAccount, err := signer.NewSignertWithMnemonic(bc.NetworkSpecificData.SuiAccount.Mnemonic)
		require.NoError(t, err)
		rsp, err := cli.SuiXGetAllBalance(context.Background(), models.SuiXGetAllBalanceRequest{
			Owner: signerAccount.Address,
		})
		require.NoError(t, err)
		fmt.Printf("My funds: %v\n", rsp)
	})
}
Test Private Keys
Since Sui doesn't have official local development chain we are using real node and generating mnemonic at start then funding that account through internal faucet, see
	// network is already funded, here are the keys
	_ = bc.NetworkSpecificData.SuiAccount.Mnemonic
	_ = bc.NetworkSpecificData.SuiAccount.PublicBase64Key
	_ = bc.NetworkSpecificData.SuiAccount.SuiAddress
TRON Blockchain Client
Configuration
[blockchain_a]
  type = "tron"
  # image = "tronbox/tre:1.0.3" is default image
Default port is 9090
Usage
package examples

import (
	"github.com/smartcontractkit/chainlink-testing-framework/framework"
	"github.com/smartcontractkit/chainlink-testing-framework/framework/components/blockchain"
	"github.com/stretchr/testify/require"
	"testing"
)

type CfgTron struct {
	BlockchainA *blockchain.Input `toml:"blockchain_a" validate:"required"`
}

func TestTRONSmoke(t *testing.T) {
	in, err := framework.Load[CfgTron](t)
	require.NoError(t, err)

	bc, err := blockchain.NewBlockchainNetwork(in.BlockchainA)
	require.NoError(t, err)

	// all private keys are funded
	_ = blockchain.TRONAccounts.PrivateKeys[0]

	t.Run("test something", func(t *testing.T) {
		// use internal URL to connect Chainlink nodes
		_ = bc.Nodes[0].InternalHTTPUrl
		// use host URL to interact
		_ = bc.Nodes[0].ExternalHTTPUrl

		// use bc.Nodes[0].ExternalHTTPUrl + "/wallet" to access full node
		// use bc.Nodes[0].ExternalHTTPUrl + "/walletsolidity" to access Solidity node
	})
}
More info
Follow the guide if you want to work with TRONBox environment via JS
Golang HTTP Client
TRON doesn't have any library to interact with it in Golang but we maintain our internal fork here
Check TRON HTTP API
Full node is on :9090/wallet
curl -X POST http://127.0.0.1:9090/wallet/createtransaction -d '{
    "owner_address": "TRGhNNfnmgLegT4zHNjEqDSADjgmnHvubJ",
    "to_address": "TJCnKsPa7y5okkXvQAidZBzqx3QyQ6sxMW",
    "amount": 1000000,
    "visible": true
}'
Solidity node is on :9090/walletsolidity
curl -X POST http://127.0.0.1:9090/walletsolidity/getaccount -d '{"address": "41E552F6487585C2B58BC2C9BB4492BC1F17132CD0"}'
ZKSync clients
We support Anvil ZKSync memory blockchain in a Docker image. It is a fork of Anvil with support for ZK Sync transactions and ZK VM.
Components are managed as EVM components.
The component will create a temporary Dockerfile that pulls the Anvil ZKSync executables from https://raw.githubusercontent.com/matter-labs/foundry-zksync/main/install-foundry-zksync as per ZK Sync documentation.
Configuration
Use type: 'anvil-zksync' to use Anvil ZKSync.
The configurable arguments are two:
chain_id, defaults to"260"port, defaults to"8011"
Test Private Keys
Testing keys are exported in the blockchain go module under AnvilZKSyncRichAccountPks.
TON Blockchain Client
TON (The Open Network) support in the framework utilizes MyLocalTon Docker environment to provide a minimal local TON blockchain for testing purposes.
Configuration
[blockchain_a]
  type = "ton"
  image = "ghcr.io/neodix42/mylocalton-docker:latest"
  port = "8000"
Genesis Container Parameters
The genesis container supports additional environment variables that can be configured through the custom_env field. These parameters allow you to customize the blockchain behavior:
[blockchain_a]
  type = "ton"
  image = "ghcr.io/neodix42/mylocalton-docker:latest"
  port = "8000"

  [blockchain_a.custom_env]
  VERSION_CAPABILITIES = "11"
The custom_env parameters will override the default genesis container environment variables, allowing you to customize blockchain configuration as needed. More info on parameters can be found here https://github.com/neodix42/mylocalton-docker/wiki/Genesis-setup-parameters.
Network Configuration
The framework provides direct access to TON liteserver connections through pre-formatted liteserver URLs. The ExternalHTTPUrl and InternalHTTPUrl contain ready-to-use liteserver connection strings in the format liteserver://publickey@host:port, eliminating the need to fetch and parse separate configuration files.
Default Ports
The TON implementation exposes essential services through port mapping:
- TON Simple HTTP Server: External dynamic port → Internal port 8000
- TON Lite Server: External dynamic port → Internal dynamic port (base + 100 offset)
The framework automatically handles port mapping and provides ready-to-use liteserver connection URLs.
Note:
tonutils-golibrary is used for TON blockchain interactions, which requires a TON Lite Server connection. The framework provides direct liteserver:// URLs that can be used immediately without additional configuration parsing.
Usage
package examples

import (
  "context"
  "fmt"
  "strings"
  "testing"

  "github.com/stretchr/testify/require"
  "github.com/xssnick/tonutils-go/liteclient"
  "github.com/xssnick/tonutils-go/ton"
  "github.com/xssnick/tonutils-go/ton/wallet"

  "github.com/smartcontractkit/chainlink-testing-framework/framework"
  "github.com/smartcontractkit/chainlink-testing-framework/framework/components/blockchain"
)

type CfgTon struct {
  BlockchainA *blockchain.Input `toml:"blockchain_a" validate:"required"`
}

// getConnectionPoolFromLiteserverURL parses a liteserver:// URL and creates a connection pool
func getConnectionPoolFromLiteserverURL(ctx context.Context, liteserverURL string) (*liteclient.ConnectionPool, error) {
  // Parse the liteserver URL, expected format: liteserver://publickey@host:port
  if !strings.HasPrefix(liteserverURL, "liteserver://") {
    return nil, fmt.Errorf("invalid liteserver URL format: expected liteserver:// prefix")
  }

  // Remove the liteserver:// prefix
  urlPart := strings.TrimPrefix(liteserverURL, "liteserver://")

  // Split by @ to separate publickey and host:port
  parts := strings.Split(urlPart, "@")
  if len(parts) != 2 {
    return nil, fmt.Errorf("invalid liteserver URL format: expected publickey@host:port")
  }

  publicKey := parts[0]
  hostPort := parts[1]

  connectionPool := liteclient.NewConnectionPool()
  err := connectionPool.AddConnection(ctx, hostPort, publicKey)
  if err != nil {
    return nil, fmt.Errorf("failed to add liteserver connection: %w", err)
  }

  return connectionPool, nil
}

func TestTonSmoke(t *testing.T) {
  in, err := framework.Load[CfgTon](t)
  require.NoError(t, err)

  bc, err := blockchain.NewBlockchainNetwork(in.BlockchainA)
  require.NoError(t, err)
  // we can also explicitly terminate the container after the test
  defer bc.Container.Terminate(t.Context())

  var client ton.APIClientWrapped

  t.Run("setup:connect", func(t *testing.T) {
    // bc.Nodes[0].ExternalHTTPUrl now contains: "liteserver://publickey@host:port"
    liteserverURL := bc.Nodes[0].ExternalHTTPUrl

    // Create connection pool from liteserver URL
    connectionPool, err := getConnectionPoolFromLiteserverURL(t.Context(), liteserverURL)
    require.NoError(t, err, "Failed to create connection pool from liteserver URL")

    // Create API client
    client = ton.NewAPIClient(connectionPool).WithRetry()

    t.Run("setup:faucet", func(t *testing.T) {
      // Create a wallet from the pre-funded high-load wallet seed
      rawHlWallet, err := wallet.FromSeed(client, strings.Fields(blockchain.DefaultTonHlWalletMnemonic), wallet.HighloadV2Verified)
      require.NoError(t, err, "failed to create highload wallet")

      // Create a workchain -1 (masterchain) wallet
      mcFunderWallet, err := wallet.FromPrivateKeyWithOptions(client, rawHlWallet.PrivateKey(), wallet.HighloadV2Verified, wallet.WithWorkchain(-1))
      require.NoError(t, err, "failed to create highload wallet")

      // Get subwallet with ID 42
      funder, err := mcFunderWallet.GetSubwallet(uint32(42))
      require.NoError(t, err, "failed to get highload subwallet")

      // Verify the funder address matches the expected default
      require.Equal(t, funder.Address().StringRaw(), blockchain.DefaultTonHlWalletAddress, "funder address mismatch")

      // Check the funder balance
      master, err := client.GetMasterchainInfo(t.Context())
      require.NoError(t, err, "failed to get masterchain info for funder balance check")
      funderBalance, err := funder.GetBalance(t.Context(), master)
      require.NoError(t, err, "failed to get funder balance")
      require.Equal(t, funderBalance.Nano().String(), "1000000000000000", "funder balance mismatch")
    })
  })
}
Test Private Keys
The framework includes a pre-funded high-load wallet for testing purposes. This wallet type can send up to 254 messages per 1 external message, making it efficient for test scenarios.
Default High-Load Wallet:
Address: -1:5ee77ced0b7ae6ef88ab3f4350d8872c64667ffbe76073455215d3cdfab3294b
Mnemonic: twenty unfair stay entry during please water april fabric morning length lumber style tomorrow melody similar forum width ride render void rather custom coin
Available Pre-funded Wallets
MyLocalTon Docker environment comes with several pre-funded wallets that can be used for testing:
- Genesis Wallet (V3R2, WalletId: 42)
- Validator Wallets (1-5) (V3R2, WalletId: 42)
- Faucet Wallet (V3R2, WalletId: 42, Balance: 1 million TON)
- Faucet Highload Wallet (Highload V2, QueryId: 0, Balance: 1 million TON)
- Basechain Faucet Wallet (V3R2, WalletId: 42, Balance: 1 million TON)
- Basechain Faucet Highload Wallet (Highload V2, QueryId: 0, Balance: 1 million TON)
For the complete list of addresses and mnemonics, refer to the MyLocalTon Docker documentation.
Storage
Here we store Storage components: S3.
S3
The framework contains local S3 provider. Currently, we support MinIO.
Configuration
[local_s3]
host = "minio"
port = 9000
console_port = 9001
access_key = "(default:random)"
secret_key = "(default:random)"
bucket = "test-bucket"
region = "us-east-1"
Example values are defaults.
Usage
package my_test

import (
	"fmt"
	"os"
	"testing"

	"github.com/smartcontractkit/chainlink-testing-framework/framework/components/s3provider"
	"github.com/smartcontractkit/chainlink-testing-framework/framework"
	"github.com/stretchr/testify/require"
)

type Config struct {
	S3Config *s3provider.Input `toml:"local_s3" validate:"required"`
}

func TestLocalS3(t *testing.T) {
	in, err := framework.Load[Config](t)
	require.NoError(t, err)

	output, err := NewMinioFactory().NewFrom(in)
	require.NoError(t, err)

	t.log(fmt.Printf("%#v", output))
}
Alternatively, the component supports Options pattern and can be created from code:
    // ...
    s3provider, err := NewMinioFactory().New(
        WithPort(port),
        WithConsolePort(consolePort),
        WithAccessKey(accessKey),
        WithSecretKey(secretKey),
    )
    require.NoError(t, err)

    output := s3provider.Output()
	// ...
Chip Router
chiprouter is a small CTF component that owns the fixed ChIP ingress port and fans incoming telemetry out to registered downstream subscribers.
It exists to keep the local CRE topology simple:
- Chainlink nodes always publish to a single ingress owner on
50051 - lightweight test sinks subscribe behind the router
- real ChIP / Beholder subscribes behind the same router
That removes the old split where some tests bound ingress directly while others started real ChIP.
Ports
The component exposes:
- admin HTTP:
50050 - ingress gRPC:
50051
In the local CRE topology, real ChIP / Beholder typically subscribes downstream on 50053.
Image Contract
The component runs whatever image is provided in chip_router.image.
The expected local CRE convention is:
- env TOMLs use a local alias such as
chip-router:<commit-sha> - setup/pull logic is responsible for making that alias exist locally
- remote ECR image names stay in setup/pull config and are retagged locally to the alias
Runtime Behavior
The router:
- exposes a health endpoint on
/health - accepts subscriber registration over its admin API
- forwards published ChIP ingress requests to all registered subscribers
- is best-effort per subscriber, so one failing downstream does not block others
Host-based downstream subscribers should register host-reachable endpoints. In local CRE, host-local sink endpoints are normalized to the Docker host gateway before registration.
Chip Ingress Set
Chip Ingress Set is a composite component that collects Beholder events. It is a thin testcontainers-go wrapper over a Docker Compose file copied from the Atlas repo.
It consists of 3 components:
- Chip Ingress
- Red Panda
- Red Panda Console
Configuration
To add it to your stack use following TOML:
[chip_ingress]
  # using a local docker-compose file
  compose_file='file://../../components/chip_ingress_set/docker-compose.yml'
  # using a remote file
  # compose_file='https://my.awesome.resource.io/docker-compose.yml'
  extra_docker_networks = ["my-existing-network"]
Where compose file indicates the location of the docker-compose.yml file (remote URLs are supported) and extra_docker_networks an optional slice of existing Docker networks, to which whole stack should be connected to.
Exposed ports
These 3 components expose a variety of ports, but the most important ones from the point of view of user interaction are:
- schema registry port:
18081 - Kafka port:
19092 - Red Panda console port:
8080
Useful helper methods
Packge contains also a bunch of helper functions tha can:
- create and delete Kafka topics
- fetch
.protofiles from remote repositories and register them with Red Panda
Topic management
import chipingressset "github.com/smartcontractkit/chainlink-testing-framework/framework/components/dockercompose/chip_ingress_set"

topicsErr := chipingressset.DeleteAllTopics(cmd.Context(), redPandaKafkaURLFlag)
if topicsErr != nil {
    panic(topicsErr)
}

createTopicsErr := chipingressset.CreateTopics(ctx, out.RedPanda.KafkaExternalURL, []string{"cre"})
if createTopicsErr != nil {
    panic(createTopicsErr)
}
Protobuf schema registration
out, outErr := chipingressset.New(in.ChipIngress)
if outErr != nil {
    panic(outErr)
}

ctx, cancel := context.WithTimeout(context.Background(), 2*time.Minute)
defer cancel()

protoErr := chipingressset.DefaultRegisterAndFetchProtos(
    ctx,
    nil, // GH client will be created dynamically, if needed
    []chipingressset.RepoConfiguration{
    {
        URI:   "https://github.com/smartcontractkit/chainlink-protostractkit",
        Ref:     "626c42d55bdcb36dffe0077fff58abba40acc3e5",
        Folders: []string{"workflows"},
    },
}, out.RedPanda.SchemaRegistryExternalURL)
if protoErr != nil {
    panic(protoErr)
}
Since ProtoSchemaSet has TOML tags you can also read it from a TOML file with this content:
[[proto_schema_set]]
# reading from remote registry (only github.com supported)
uri = 'https://github.com/smartcontractkit/chainlink-protos'
ref = '626c42d55bdcb36dffe0077fff58abba40acc3e5'
folders = ['workflows']
subject_prefix = 'cre-'

[[proto_schema_set]]
# reading from local folder
uri = 'file://../../chainlink-protos'
# ref is not supported, when reading from local folders
folders = ['workflows']
subject_prefix = 'cre-'
And then use this Go code to register them:
var protoSchemaSets []chipingressset.ProtoSchemaSet
for _, schemaSet := range configFiles {
    file, fileErr := os.ReadFile(schemaSet)
    if fileErr != nil {
        return errors.Wrapf(fileErr, "failed to read proto schema set config file: %s", schemaSet)
    }

    type protoSchemaSets struct {
        Sets []chipingressset.ProtoSchemaSet `toml:"proto_schema_set"`
    }

    var sets protoSchemaSets
    if err := toml.Unmarshal(file, &sets); err != nil {
        return errors.Wrapf(err, "failed to unmarshal proto config file: %s", protoConfig)
    }

    protoSchemaSets = append(reposConfigs, sets.Sets...)
}
Registration logic is very simple and should handle cases of protos that import other protos as long they are all available in the ProtoSchemaSets provided to the registration function. That function uses an algorithm called "topological sorting by trail", which will try to register all protos in a loop until it cannot register any more protos or it has registered all of them. That allows us to skip dependency parsing completely.
Kafka doesn't have any automatic discoverability mechanism for subject - schema relationship (it has to be provided out-of-band). Currenly, we create the subject in the following way: <subject_prefix>..proto file is ever registered.
Protobuf caching
Once fetched from https://github.com protobuf files will be saved in .local/share/beholder/protobufs/<OWNER>/<REPOSTIORY>/<SHA> folder and subsequently used. If saving to cache or reading from it fails, we will load files from the original source.
Troubleshooting
Can't start ctf obs u
Error response from daemon: error while creating mount source path '/host_mnt/Users/fsldkfs/Downloads/compose/conf/provisioning/dashboards/cadvisor/cadvisor.json': mkdir /host_mnt/Users/sdfjskj/Downloads/compose/conf/provisioning: operation not permitted
exit status 1
Solution
Enable Docker to access your directory
Docker Desktop -> Settings -> Resources -> File Sharing
Can't run anvil, issue with Rosetta
2024/11/27 15:20:27 ⏳ Waiting for container id 79f8a68c07cc image: ghcr.io/foundry-rs/foundry:stable. Waiting for: &{Port:8546 timeout:0x14000901278 PollInterval:100ms skipInternalCheck:false}
2024/11/27 15:20:27 container logs (all exposed ports, [8546/tcp], were not mapped in 5s: port 8546/tcp is not mapped yet
wait until ready: check target: retries: 1, port: "", last err: container exited with code 133):
rosetta error: Rosetta is only intended to run on Apple Silicon with a macOS host using Virtualization.framework with Rosetta mode enabled
Solution
Update your docker to Docker version 27.3.1, build ce12230
Can't see any Docker metrics with Cadvisor
CPU/Memory metrics are not displayed on dashboards.
Cadvisor container can't mount some layers.
E1209 13:14:49.908130 1 manager.go:1116] Failed to create existing container: /docker/aa40875c382af890861447fa8aaf6908978041b9077bb81029971d23929f8c4d: failed to identify the read-write layer ID for container "aa40875c382af890861447fa8aaf6908978041b9077bb81029971d23929f8c4d". - open /rootfs/var/lib/docker/image/overlayfs/layerdb/mounts/aa40875c382af890861447fa8aaf6908978041b9077bb81029971d23929f8c4d/mount-id: no such file or directory
This can happen due to Docker Desktop updates, the issue is that the symlink to Docker socket is broken.
Solution
Make sure you are not using containerd to store or pull images, see the issue
Disable and enable the option Allow the default Docker socket to be used again to relink it properly.
Mono Repository Tooling
In our multi-module Go repository, we use tools like:
- DevBox
- Just
- Matrix CI pattern
Open DevBox shell:
devbox shell
Install pre-commit hooks first:
just install
Testing
Each package has tests, run using commands in the justfile, examples:
# run all the tests (cache)
just test-all
# run package tests with regex
just test wasp TestSmoke
# run all package tests
just test tools/ghlatestreleasechecker ./...
Linting
Use linters:
# all packages
just lint-all
# one package
just lint wasp
Updating dev deps (DevBox)
For extra dependencies, we use NixHub to add them to DevBox, which also works in CI.
Don't forget to update the lockfile after adding new deps and commit the changes:
devbox update
Updating Docs (MDBook)
just book
Overview
CTF monorepository contains a set of libraries:
- WASP - Scalable protocol-agnostic load testing library for
Go - Havoc - Chaos testing library
- Seth - Ethereum client library with transaction tracing and gas bumping
Overview
CTF monorepository contains a set of libraries:
- WASP - Scalable protocol-agnostic load testing library for
Go - Havoc - Chaos testing library
- Seth - Ethereum client library with transaction tracing and gas bumping
WASP - Overview
WASP is a lightweight load testing harness that makes it easy to compose load profiles of varying complexity using arbitrary Go code.

Main Features
- Predictable performance footprint
- Flexible, non-opinionated reporting that pushes data to
Loki - Supports both stateless and stateful protocols
- Compatible with open and closed load models
- Includes a default Grafana dashboard with reusable components
Sounds interesting? Let's get started!
WASP - Getting Started
Prerequisites
Setup
To start writing tests, create a directory for your project with a go.mod file, then add the WASP package:
go get github.com/smartcontractkit/chainlink-testing-framework/wasp
warning
To execute any of the tests from the next chapters, you need access to Loki and Grafana.
You can find instructions on setting them up locally here.
That was simple, wasn't it? Time to write your first test.
WASP - First Test (RPS Test)
Requirements
- Go installed
- Loki
Let's start by creating a simple test that sends 5 HTTP requests per second for 60 seconds.
We will use a Gun, which is designed for stateless protocols like HTTP or measuring throughput.
A Gun only needs to implement this single-method interface:
type Gun interface {
	Call(l *Generator) *Response
}
Defining the Gun
First, let's define a struct that will hold our Gun implementation:
type ExampleGun struct {
	target string
	client *resty.Client
	Data   []string
}
Our Gun will send a GET request to the target URL. If the request is successful, we return a *wasp.Response containing the response data. If it fails or responds with an HTTP status other than 200, we also return a *wasp.Response with the response and an error.
Here’s the implementation of the Gun interface:
func (m *ExampleGun) Call(l *wasp.Generator) *wasp.Response {
	var result map[string]interface{}
	r, err := m.client.R().
		SetResult(&result).
		Get(m.target)
	if err != nil {
		return &wasp.Response{Data: result, Error: err.Error()}
	}
	if r.Status() != "200 OK" {
		return &wasp.Response{Data: result, Error: "not 200"}
	}
	return &wasp.Response{Data: result}
}
note
By default, WASP stores all successful and failed responses, but you can use a Sampler to store only some of the successful ones. You can read more about it here.
Writing the Test
Now that we have a Gun, let’s write the test:
func TestGun(t *testing.T) {
	// start mock HTTP server
	srv := wasp.NewHTTPMockServer(nil)
	srv.Run()

	// define labels to differentiate one run from another
	labels := map[string]string{
		// check variables in dashboard/dashboard.go
		"go_test_name": "TestGun",
		"gen_name":     "test_gun",
		"branch":       "my-awesome-branch",
		"commit":       "f3729fa",
	}

	// create generator
	gen, err := wasp.NewGenerator(&wasp.Config{
		LoadType: wasp.RPS,
		// plain line profile - 5 RPS for 60s
		Schedule:   wasp.Plain(5, 60*time.Second),
		Gun:        NewExampleHTTPGun(srv.URL()),
		Labels:     labels,
		LokiConfig: wasp.NewEnvLokiConfig(),
	})
	if err != nil {
		panic(err)
	}
	// run the generator and wait until it finishes
	gen.Run(true)
}
note
We used the LoadType of wasp.RPS since this is the only type of load that a Gun can handle.
You can read more about load types here.
note
You can learn more about different labels and their functions here.
note
wasp.NewEnvLokiConfig() configures Loki using environment variables. You can read about them here.
Conclusion
And that's it! You’ve just created your first test using WASP. You can now run it using:
go test -v -run TestGun
You can find the full example here.
What’s Next?
What if you want to test a more complex scenario?
First, we’ll look at a stateful protocol test, like WebSocket. Then, we’ll explore a hypothetical user journey test, where multiple requests need to be executed.
WASP - Stateful Protocol Testing
WASP allows you to test stateful protocols like WebSocket. These protocols are more complex than stateless protocols, which is reflected in the slightly higher complexity of the interface to be implemented: the VirtualUser interface.
type VirtualUser interface {
	Call(l *Generator)
	Clone(l *Generator) VirtualUser
	Setup(l *Generator) error
	Teardown(l *Generator) error
	Stop(l *Generator)
	StopChan() chan struct{}
}
Defining the Virtual User
As before, let's start by defining a struct that will hold our VirtualUser implementation:
type WSVirtualUser struct {
	target string
	*wasp.VUControl
	conn   *websocket.Conn
	Data   []string
}
Implementing the Clone Method
We will begin by implementing the Clone() function, used by WASP to create new instances of the VirtualUser:
func (m *WSVirtualUser) Clone(_ *wasp.Generator) wasp.VirtualUser {
	return &WSVirtualUser{
		VUControl: wasp.NewVUControl(),
		target:    m.target,
		Data:      make([]string, 0),
	}
}
Implementing the Setup Method
Next, we implement the Setup() function, which establishes a connection to the WebSocket server:
func (m *WSVirtualUser) Setup(l *wasp.Generator) error {
	var err error
	m.conn, _, err = websocket.Dial(context.Background(), m.target, &websocket.DialOptions{})
	if err != nil {
		l.Log.Error().Err(err).Msg("failed to connect from vu")
		_ = m.conn.Close(websocket.StatusInternalError, "")
		return err
	}
	return nil
}
We will omit the Teardown() function for brevity, but it should be used to close the connection to the WebSocket server.
Additionally, we do not need to implement the Stop() or StopChan() functions because they are already implemented in the VUControl struct.
Implementing the Call Method
Now, we implement the Call() function, which is used to receive messages from the WebSocket server:
func (m *WSVirtualUser) Call(l *wasp.Generator) {
	startedAt := time.Now()
	v := map[string]string{}
	err := wsjson.Read(context.Background(), m.conn, &v)
	if err != nil {
		l.Log.Error().Err(err).Msg("failed read ws msg from vu")
		l.ResponsesChan <- &wasp.Response{StartedAt: &startedAt, Error: err.Error(), Failed: true}
		return
	}
	l.ResponsesChan <- &wasp.Response{StartedAt: &startedAt, Data: v}
}
As you can see, instead of returning a single response directly from Call(), we send it to the ResponsesChan channel.
This is done, so that we can send each response independently to Loki instead of waiting for the whole call to finish.
Writing the Test
Now, let's write the test:
func TestVirtualUser(t *testing.T) {
	// start mock WebSocket server
	s := httptest.NewServer(wasp.MockWSServer{
		Sleep: 50 * time.Millisecond,
	})
	defer s.Close()
	time.Sleep(1 * time.Second)

	// some parts omitted for brevity

	// create generator
	gen, err := wasp.NewGenerator(&wasp.Config{
		LoadType: wasp.VU,
		// plain line profile - 5 VUs for 60s
		Schedule:   wasp.Plain(5, 60*time.Second),
		VU:         NewExampleVirtualUser(url),
		Labels:     labels,
		LokiConfig: wasp.NewEnvLokiConfig(),
	})
	if err != nil {
		panic(err)
	}
	// run the generator and wait until it finishes
	gen.Run(true)
}
Conclusion
That wasn’t so difficult, was it? You can now test your WebSocket server with WASP. You can find a full example here.
What’s Next?
Now, let’s explore how to test a more complex scenario where a VirtualUser needs to perform various operations.
WASP - Testing User Journeys
Let's explore a more complex scenario where a user needs to authenticate first before performing an action. Additionally, we will introduce a slightly more advanced load profile:
- 1 user for the first 30 seconds
- 2 users for the next 30 seconds
- 3 users for the final 30 seconds
Since this is a "user journey," we will use a VirtualUser implementation to represent a user.
Defining the Virtual User
First, let's define the VirtualUser struct:
type VirtualUser struct {
	*wasp.VUControl
	target    string
	Data      []string
	rateLimit int
	rl        ratelimit.Limiter
	client    *resty.Client
}
Here, we’ve added a rate limiter to the struct, which will help limit the number of requests per second. This is useful to prevent overloading the server, especially in this test scenario where the requests are simple and fast. Without a limiter, even a small number of Virtual Users (VUs) could result in a very high RPS.
note
Since VirtualUser does not inherently limit RPS (it depends on the server's processing speed), you should implement a rate-limiting mechanism if needed.
For brevity, we'll skip the implementation of the Clone() and Teardown() functions, as they are similar to previous examples. Additionally, no Setup() is required because we are using HTTP.
Implementing Requests
User Authentication
// requestOne represents user login
func (m *VirtualUser) requestOne(l *wasp.Generator) {
	var result map[string]interface{}
	r, err := m.client.R().
		SetResult(&result).
		Get(m.target)
	if err != nil {
		l.Responses.Err(r, GroupAuth, err)
		return
	}
	l.Responses.OK(r, GroupAuth)
}
Authenticated Action (e.g., Balance Check)
// represents authenticated user action
func (m *VirtualUser) requestTwo(l *wasp.Generator) {
	var result map[string]interface{}
	r, err := m.client.R().
		SetResult(&result).
		Get(m.target)
	if err != nil {
		l.Responses.Err(r, GroupUser, err)
		return
	}
	l.Responses.OK(r, GroupUser)
}
Combining the Requests
func (m *VirtualUser) Call(l *wasp.Generator) {
	m.rl.Take() // apply rate limiting
	m.requestOne(l)
	m.requestTwo(l)
}
Writing the Test
Now, let’s write the test. Pay attention to how the three phases of the load profile are defined under Schedule:
func TestScenario(t *testing.T) {
	srv := wasp.NewHTTPMockServer(nil)
	srv.Run()

	_, err := wasp.NewProfile().
		Add(wasp.NewGenerator(&wasp.Config{
			T: t,
			LoadType: wasp.VU,
			VU:       NewExampleScenario(srv.URL()),
			Schedule: wasp.Combine(
				wasp.Plain(1, 30*time.Second),
				wasp.Plain(2, 30*time.Second),
				wasp.Plain(3, 30*time.Second),
			),
			LokiConfig: wasp.NewEnvLokiConfig(),
		})).Run(true)
	require.NoError(t, err)
}
Load Profile
We generate load in three phases:
- 1 user for the first 30 seconds
- 2 users for the next 30 seconds
- 3 users for the final 30 seconds
Conclusion
And that's it! We’ve created a test that simulates a user journey with authentication and an action requiring authentication, while varying the load during execution. You can find the full example code here.
But what if you wanted to combine multiple load generators—or even mix a Gun with a VirtualUser? Could you do that? Find out in the next chapter.
WASP - Using Profiles
In this section, we’ll explore the most complex scenario: using a VirtualUser to represent a user and a Gun to generate background load. We’ll also introduce a new load segment type that varies over time.
To bind together different Generators (such as a Gun or a VirtualUser), we’ll use a Profile. Think of it as the highest-level abstraction that fully describes the load profile.
Gun and VirtualUser
We’ll skip defining both the Gun and the VirtualUser, as they are nearly identical to previous examples. However, for the VirtualUser, we’ll use a handy wrapper for sending Response back to the channel. See if you can spot it:
// represents user login
func (m *VirtualUser) requestOne(l *wasp.Generator) {
	var result map[string]interface{}
	r, err := m.client.R().
		SetResult(&result).
		Get(m.target)
	if err != nil {
		l.Responses.Err(r, GroupAuth, err)
		return
	}
	l.Responses.OK(r, GroupAuth)
}
note
You might have noticed GroupAuth constant passed to OK() and Err() methods. This is used to group responses in the dashboard.
You can read more about it here.
Background Load Schedule for the Gun
For the RPS Gun, we’ll define a schedule where:
- During the first 10 seconds, the RPS increases by 2.5 every second.
- For the next 40 seconds, it remains steady at 5 RPS.
epsilonSchedule := wasp.Combine(
    // wasp.Steps(from, increase, steps, duration)
    wasp.Steps(1, 1, 4, 10*time.Second), // Start at 1 RPS, increment by 1 RPS in 4 steps over 10 seconds (1 increment every 2.5 seconds)
    // wasp.Plain(count, duration)
    wasp.Plain(5, 40*time.Second))       // Hold 5 RPS for 40 seconds
Virtual User Schedule
For the VirtualUser, the schedule will:
- Start with 1 user for the first 10 seconds.
- Add 1 user every 3 seconds for 30 seconds.
- Gradually reduce from 10 users to 0 over 10 seconds.
thetaSchedule := wasp.Combine(
    // wasp.Plain(count, duration)
    wasp.Plain(1, 10*time.Second),         // 1 user for the first 10 seconds
    // wasp.Steps(from, increase, steps, duration)
    wasp.Steps(1, 1, 9, 30*time.Second),  // Increment by 1 user every ~3 seconds over 30 seconds
    // wasp.Steps(from, increase, steps, duration)
    wasp.Steps(10, -1, 10, 10*time.Second)) // Decrement by 1 user every second over 10 seconds
Defining the Profile
We’ll now define our Profile to combine both the Gun and the VirtualUser:
_, err := wasp.NewProfile().
    Add(wasp.NewGenerator(&wasp.Config{
        T:          t,
        LoadType:   wasp.VU,
        GenName:    "Theta",
        Schedule:   thetaSchedule,
        VU:         NewExampleScenario(srv.URL()),
        LokiConfig: wasp.NewEnvLokiConfig(),
    })).
    Add(wasp.NewGenerator(&wasp.Config{
        T:          t,
        LoadType:   wasp.RPS,
        GenName:    "Epsilon",
        Schedule:   epsilonSchedule,
        Gun:        NewExampleHTTPGun(srv.URL()),
        LokiConfig: wasp.NewEnvLokiConfig(),
    })).
    Run(true)
Conclusion
And that’s it! You’ve created a complex load profile that simulates a growing number of users alongside a background load that varies over time. Notice the .Run(true) method, which blocks until all the Profile's generators have finished.
You can find the full example here.
note
The error returned by the .Run(true) function of a Profile might indicate the following:
- load generator did not start and instead returned an error
- or if
Profilewas created withWithGrafanaoption that enabledCheckDashboardAlertsAfterRunthat at some alerts fired. To check for errors during load generation, you need to call theErrors()method on eachGeneratorwithin theProfile.
note
Currently, it’s not possible to have a "waiting" schedule that doesn’t generate any load.
To implement such logic, start one Profile in a goroutine and use time.Sleep before starting the second Profile or start use a combination .Run(false) and .Wait() methods.
Both examples of can be found here.
What’s Next?
Now that you know how to generate load, it’s time to learn how to monitor and assert on it. Let’s move on to the next section: Testing Alerts.
WASP - Configuration
WASP can be configured using environment variables for most commonly used settings. However, to fully leverage the flexibility of WASP, you may need to use programmatic configuration for more advanced features.
Required Environment Variables
At a minimum, you need to provide the following environment variables, as WASP requires Loki:
LOKI_URL- The Loki endpoint to which logs are pushed (e.g., http://localhost:3100/loki/api/v1/push).LOKI_TOKEN- The authorization token.
Optionally, you can also provide the following:
LOKI_TENANT_ID- A tenant ID that acts as a bucket identifier for logs, logically separating them from other sets of logs. If the tenant ID doesn't exist, Loki will create it. Can be empty if log separation is not a concern.LOKI_BASIC_AUTH- Basic authentication credentials.
Alert Configuration
To enable alert checking, you need to provide the following additional environment variables, as alerts are an integral part of Grafana:
GRAFANA_URL- The base URL of the Grafana instance.GRAFANA_TOKEN- An API token with permissions to access the following namespaces:
/api/alertmanager/,/api/annotations/,/api/dashboard/,/api/datasources/,/api/v1/provisioning/, and/api/ruler/.
Grafana Dashboard Creation
If you want WASP to create a Grafana dashboard for you, provide the following environment variables:
DATA_SOURCE_NAME- The name of the data source (currently, onlyLokiis supported).DASHBOARD_FOLDER- The folder in which to create the dashboard.DASHBOARD_NAME- The name of the dashboard.
Log Level Control
You can control the log level using this environment variable:
WASP_LOG_LEVEL- Sets the log level (trace,debug,info,warn,error; defaults toinfo).
And that's it! You are now ready to start using WASP to its full potential.
note
Remember, WASP offers much more configurability through its programmatic API.
k8s
WASP - Components
In this section, we will briefly describe the main logical components that are part of the WASP library:
Brief overview of how WASP works and how different components interact with each other:
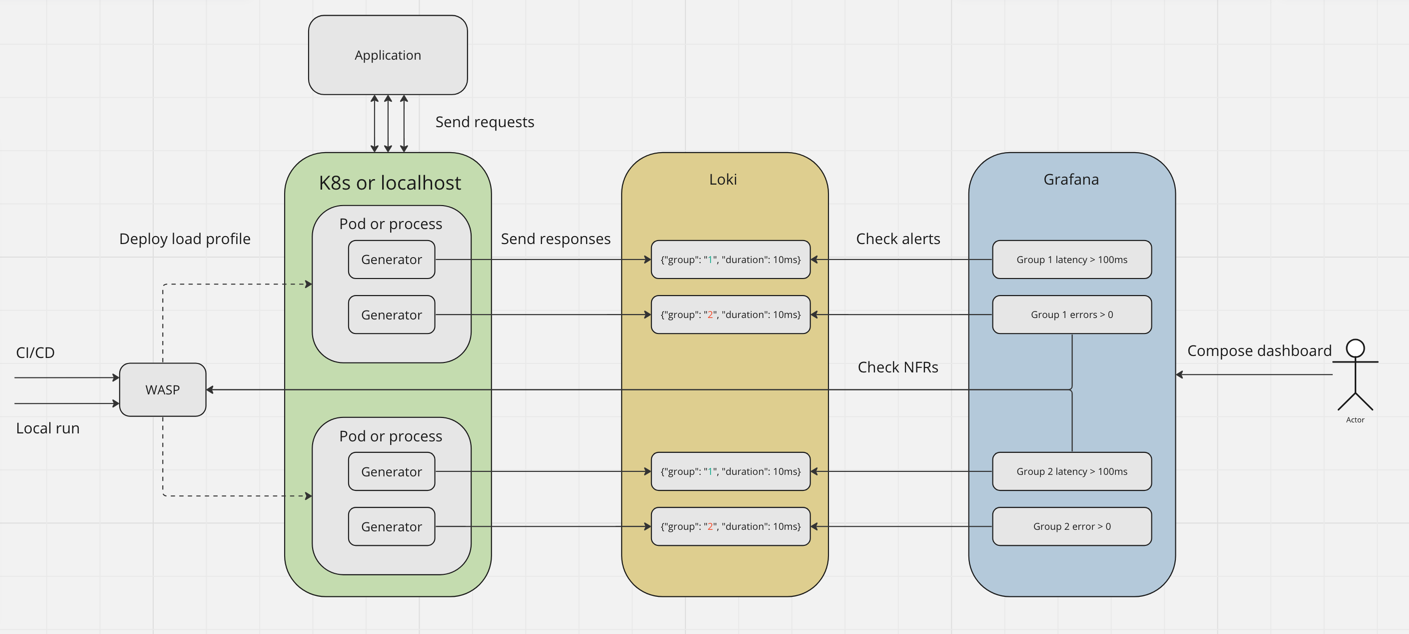
WASP - Dashboard
warning
The API used to check and create alerts is unstable, and the information related to them may be out of date.
WASP comes with a built-in dashboard that allows you to monitor test runs in real-time.
The dashboard includes several built-in metrics that integrate seamlessly with the AlertChecker component.
It is built using the Grabana library, which you can use to further customize and extend the dashboard by adding your own rows and panels.
note
To create new dashboards, you need to set certain dashboard-specific variables as described in the Configuration section.
Predefined Alerts
WASP comes with predefined alerts for:
- 99th percentile of the response time
- Response errors
- Response timeouts
You can use these predefined metrics to add simple alerts to your dashboard for conditions such as:
- Values above or below a threshold
- Averages above or below a threshold
- Percentages of the total above or below a threshold
For a complete list of available conditions, refer to Grabana's ConditionEvaluator.
Custom Alerts
Custom alerts can be composed of:
- The simple conditions mentioned above
- Arbitrary Loki queries
Custom alerts use Grabana's timeseries.Alert and must be timeseries-based.
note
Adding a built-in alert will also add a new row to the dashboard to display the monitored metric.
In contrast, custom alerts do not automatically add rows to the dashboard to prevent clutter.
Each generator has its own metrics, matched by the generator name.
Default Dashboard Panels
The default dashboard includes the following panels:
- Current RPS/VUs (depending on the generator)
- Responses per second
- Total successful requests
- Total failed requests
- Total timeout requests
- RPS/VUs per schedule segment
- Responses per second
- Latency quantiles over groups (p99, p90, p50)
- Response latencies over time
- Logs size per second
- Sampling statistics
- Failed & timed-out responses
- Logs of the statistics-pushing service
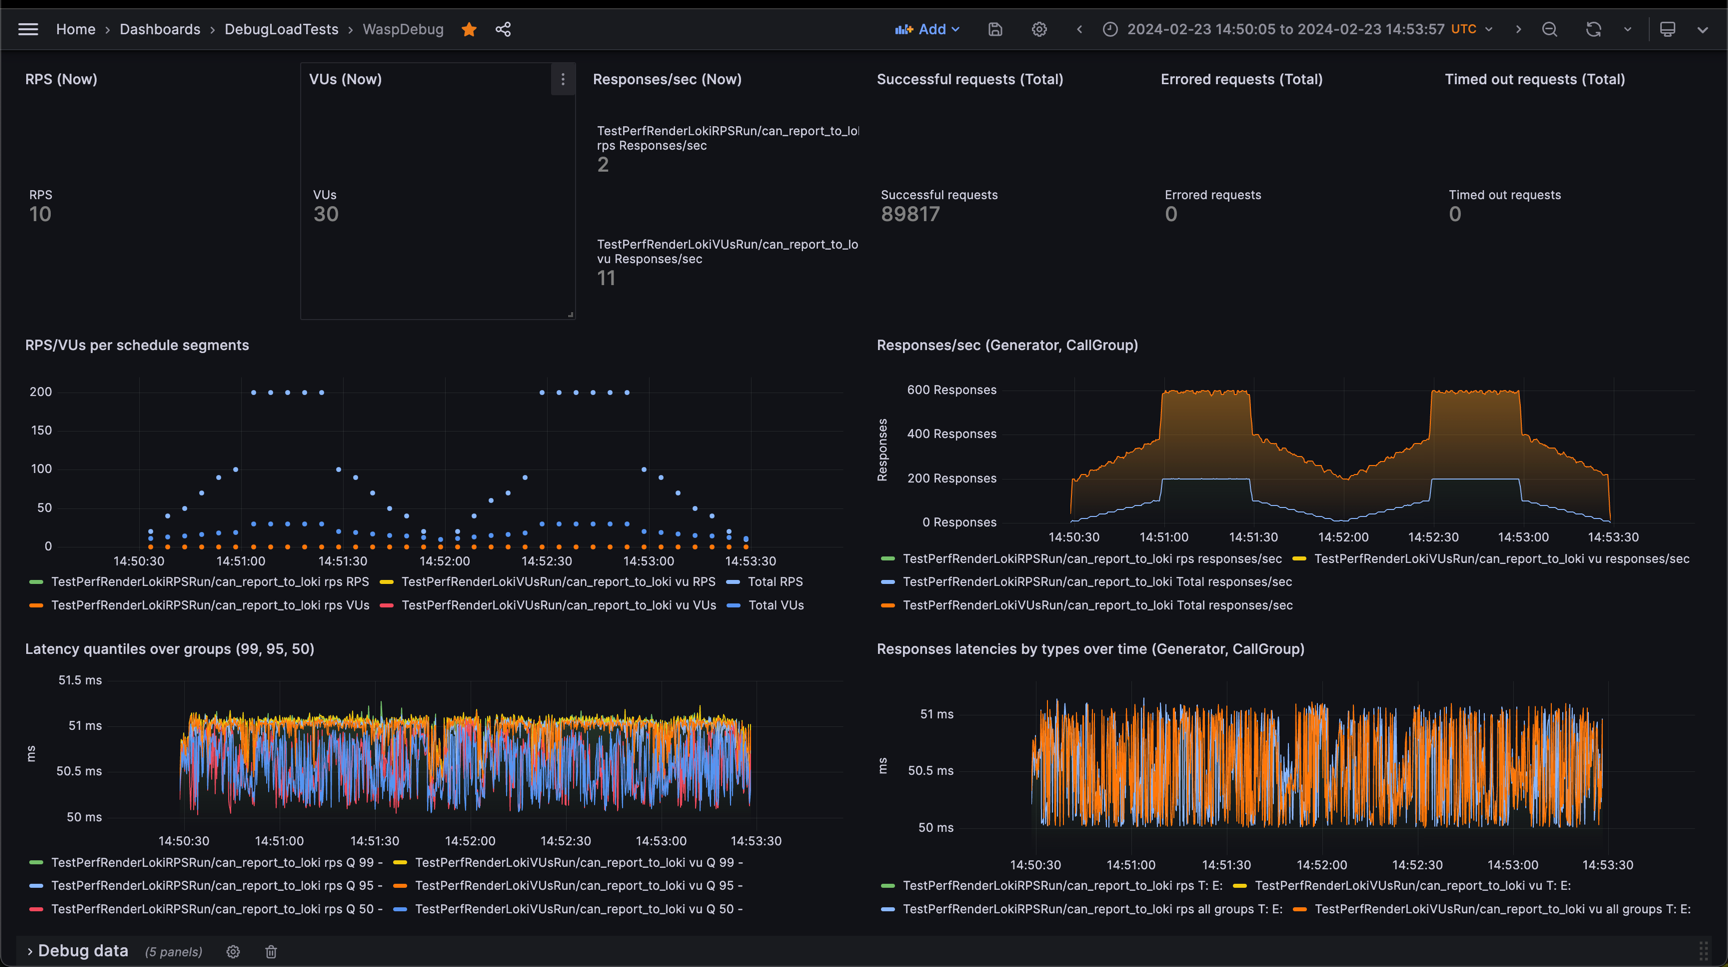
Where applicable, these panels group results by generator name (gen_name label) and call group (call_group label).
note
You can read more about using labels in the Use labels section.
Creating a New Dashboard with Alerts
For a practical example of how to create a new dashboard with alerts, see the Testing Alerts section.
WASP - Generator
A Generator is a component that encapsulates all the characteristics of load generation, including:
- Load type:
- RPS (requests per second)
- VUs (virtual users)
- Load schedule
- Call logic
- Response data
- Sampling
- Timeouts
warning
RPS load type can only be used with a Gun, while VUs can only be used with a VirtualUser.
Choosing Between Gun and VirtualUser
Gun
- Best for stateless protocols (e.g., HTTP).
- Simplistic in nature; ideal for executing a single operation that does not require setup or teardown.
- Operates using an open model, where:
- The number of requests is fixed.
- The load adjusts to meet the target RPS, regardless of the system's response time.
- There's no feedback from the system.
- Recommended for scenarios focused on measuring throughput.
VirtualUser
- Designed for stateful protocols (e.g.,
WebSocket) or workflows involving multiple operations (e.g., authenticating, executing tasks, and logging out). - More complex, with dedicated methods for setup and teardown.
- Operates using a closed model, where:
- New iterations start only after the previous one completes.
- The RPS fluctuates based on the system's response time. Longer response times reduce RPS.
- Feedback from the system is used to adjust the load.
Closed vs. Open Models
-
A
Gunfollows an open model:- It controls the rate of requests being sent.
- The system's response time does not impact the load generation rate.
-
A
VirtualUserfollows a closed model:- It controls the rate of receiving responses.
- The system's response time directly impacts the load generation rate. If the system slows down, iterations take longer, reducing the RPS.
Summary
In simpler terms:
- A
Gunlimits the load during the sending phase, making it ideal for throughput measurements. - A
VirtualUserlimits the load during the receiving phase, reflecting the system's performance under load.
This distinction helps you decide which tool to use based on the protocol type and the goals of your test.
WASP - Loki
Loki is a component responsible for pushing batches of statistics to a Loki instance. It operates in the background using a promtail client.
Key features include:
- Optional basic authentication support.
- Configurable batch sizes.
- Support for configurable backoff retries, among others.
By default, a test will fail on the first error encountered while pushing data. You can modify this behavior by setting the maximum allowed errors:
- Setting the value to
-1disables error checks entirely.
note
While it is technically possible to execute a WASP test without Loki, doing so means you won't have access to load-generation-related metrics.
Unless your sole interest is in the metrics sent by your application, it is highly recommended to use Loki.
For this reason, Loki is considered an integral part of the WASP stack.
WASP - Profile
A Profile allows you to combine load from different generators. Each generator operates according to its own schedule, and you can even mix RPS and VU load types, as shown in this example.
note
The error returned by the .Run(true) function of a Profile might indicate the following:
- load generator did not start and instead returned an error
- or if
Profilewas created withWithGrafanaoption that enabledCheckDashboardAlertsAfterRunthat at some alerts fired. To check for errors during load generation, you need to call theErrors()method on eachGeneratorwithin theProfile.
Timing Considerations
It is not possible to have different generators in the same Profile start load generation at different times.
If you need staggered start times, you must use separate Profiles and handle timing in your Go code.
An example demonstrating this can be found here.
WASP - Sampler
By default, WASP saves all successful, failed, and timed-out responses in each Generator.
The Sampler component allows you to programmatically set the sampling ratio for successful responses (a value between 0 and 100).
For example, if you set the sampling ratio to 10, only 10% of successful responses will be saved:
samplerCfg := &SamplerConfig{
    SuccessfulCallResultRecordRatio: 10,
}

g := &Generator{
    sampler: NewSampler(samplerCfg),
    // other fields
}
WASP - Schedule
The Schedule component allows you to define the load characteristics for each Generator.
A schedule is composed of various Segments, each characterized by the number of requests (or VUs) and duration.
Helper Functions for Defining Schedules
WASP provides several helper functions to define schedules in a human-readable way:
Plain: Defines a segment with a stable load.Steps: Defines a segment with increasing or decreasing load, using a specified step size.
Custom Schedules
You can also define schedules programmatically by directly composing segments to suit your specific requirements.
WASP - How to's
In this section we will deal with the most common issues or questions:
- How to start local observability stack?
- How to chose between RPS and VUs?
- How to define NFRs and check alerts?
- How to use labels?
- How to incorporate load tests in your workflow?
- How to reuse dashboard components?
- How to parallelize load?
- How to debug Loki errors?
WASP - How to Start Local Observability Stack
To execute all examples or tests locally, you need to configure a local observability stack.
We have 2 versions of popular stacks: LGTM (Grafana, Loki, Prometheus) and VictoriaMetrics + OTEL (Grafana, VictoriaMetrics, VictoriaLogs, OTEL).
LGTM
just lgtm-up # from "wasp" directory
cd examples/profiles && WASP_LOG_SEND_METHOD=loki go test -v -run TestNodeMixed && cd -
just lgtm-down
Don't forget to remove the stack when you are done!
VictoriaMetrics + OTEL
just victoria-up # from "wasp" directory
cd examples/profiles && WASP_LOG_SEND_METHOD=otel go test -v -run TestNodeMixed && cd -
just victoria-down
WASP - How to Choose Between RPS and VUs
When writing a test, you need to decide whether to use RPS or VUs as your load type.
warning
RPS load type can only be used with a Gun, and VUs can only be used with a VirtualUser.
RPS (Requests Per Second)
You should use RPS when your goal is to measure throughput. This load type implements an open model, where:
- The number of requests is fixed.
- The load is adjusted to meet the target RPS.
- The system's response time has no impact on the rate of load generation.
In an RPS-based test, new requests are sent continuously, regardless of how long previous requests take.
note
Read here how to define the RPS load in terms of requests per minute or per hour instead of default per second.
Example RPS Test Diagram
---
title: RPS test
---
sequenceDiagram
    participant Profile(Test)
    participant Scheduler
    participant Generator(Gun)
    participant Promtail
    participant Loki
    participant Grafana
    loop Test Execution
        Profile(Test) ->> Generator(Gun): Start with (API, TestData)
        loop Schedule
            Scheduler ->> Scheduler: Process schedule segment
            Scheduler ->> Generator(Gun): Set new RPS target
            loop RPS load
                Generator(Gun) ->> Generator(Gun): Execute Call() in parallel
                Generator(Gun) ->> Promtail: Save CallResult
            end
            Promtail ->> Loki: Send batch<br/>when ready or timeout
        end
        Scheduler ->> Scheduler: All segments done<br/>wait all responses<br/>test ends
        Profile(Test) ->> Grafana: Check alert groups<br/>FAIL or PASS the test
    end
VirtualUser (VUs)
Use VUs when working with stateful protocols or workflows. With VirtualUser, the requests per second rate cannot be guaranteed because:
- Each iteration begins only after the previous one finishes.
- The load follows a closed model, where the system's response time affects the RPS.
If the system takes longer to respond, iterations take longer, and the RPS decreases.
Example VUs Test Diagram
---
title: VUs test
---
sequenceDiagram
    participant Profile(Test)
    participant Scheduler
    participant Generator(VUs)
    participant VU1
    participant VU2
    participant Promtail
    participant Loki
    participant Grafana
    loop Test Execution
        Profile(Test) ->> Generator(VUs): Start with (API, TestData)
        loop Schedule
            Scheduler ->> Scheduler: Process schedule segment
            Scheduler ->> Generator(VUs): Set new VUs target
            loop VUs load
                Generator(VUs) ->> Generator(VUs): Add/remove VUs
                Generator(VUs) ->> VU1: Start/end
                Generator(VUs) ->> VU2: Start/end
                VU1 ->> VU1: Run loop, execute multiple calls
                VU1 ->> Promtail: Save []CallResult
                VU2 ->> VU2: Run loop, execute multiple calls
                VU2 ->> Promtail: Save []CallResult
                Promtail ->> Loki: Send batch<br/>when ready or timeout
            end
        end
        Scheduler ->> Scheduler: All segments done<br/>wait all responses<br/>test ends
        Profile(Test) ->> Grafana: Check alert groups<br/>FAIL or PASS the test
    end
In this model, VU2 starts only after VU1 has finished its iteration.
Summary
-
Use RPS for:
- Stateless protocols.
- Measuring throughput.
- Scenarios where the load generation rate must remain constant.
-
Use VUs for:
- Stateful protocols.
- Workflows that involve multiple steps.
- Scenarios where response time impacts the load generation rate.
note
Learn more about open and closed models here.
WASP - How to configure requests per minute or hour
By default, WASP schedule describes requests per second, but what if you want to define the load in terms of requests per minute or per hour? RateLimitUnitDuration to the rescue!
If you want to execute 10 requests per minute, you'd use this generator config:
gen, err := wasp.NewGenerator(&wasp.Config{
    LoadType: wasp.RPS,
    Schedule:   wasp.Plain(10, 2*time.Hour),      // plain line profile - 10 requests per minute for 2h
    Gun:        NewExampleHTTPGun(srv.URL()),
    Labels:     labels,
    LokiConfig: wasp.NewEnvLokiConfig(),
    RateLimitUnitDuration: time.Minute,           // <---- this is the key setting
})
if err != nil {
    panic(err)
}
In other words you could say that RateLimitUnitDuration represents the denominator of rate limit duration and RPS value in the schedule the numeral.
WASP - How to Define NFRs and Check Alerts
WASP allows you to define and monitor Non-Functional Requirements (NFRs) by grouping them into categories for independent checks. Ideally, these NFRs should be defined as dashboard-as-code and committed to your Git repository. However, you can also create them programmatically on an existing or new dashboard.
Defining Alerts
WASP supports two types of alerts:
Built-in Alerts
These alerts are automatically supported by every generator and are based on the following metrics:
- 99th quantile (p99)
- Errors
- Timeouts
You can specify simple alert conditions such as:
- Value above or below
- Average
- Median
These conditions use Grabana's ConditionEvaluator.
Custom Alerts
Custom alerts can be much more complex and can:
- Combine multiple simple conditions.
- Execute Loki queries.
Custom alerts use Grabana's timeseries.Alert and must be timeseries-based.
note
For a programmatic example, check the alerts example.
Checking Alerts
Once you have a dashboard with alerts, you can choose between two approaches:
1. Automatic Checking with Profile and GrafanaOpts
You can automatically check alerts and add dashboard annotations by utilizing the WithGrafana() function with a wasp.Profile. This approach integrates dashboard annotations and evaluates alerts after the test run.
Example:
_, err = wasp.NewProfile().
    WithGrafana(grafanaOpts).
    Add(wasp.NewGenerator(getLatestReportByTimestampCfg)).
    Run(true)
require.NoError(t, err)
Where GrafanaOpts is defined as:
type GrafanaOpts struct {
	GrafanaURL                   string        `toml:"grafana_url"`
	GrafanaToken                 string        `toml:"grafana_token_secret"`
	WaitBeforeAlertCheck         time.Duration `toml:"grafana_wait_before_alert_check"`                  // Cooldown period before checking for alerts
	AnnotateDashboardUIDs        []string      `toml:"grafana_annotate_dashboard_uids"`                  // Dashboard UIDs to annotate the start and end of the run
	CheckDashboardAlertsAfterRun []string      `toml:"grafana_check_alerts_after_run_on_dashboard_uids"` // Dashboard UIDs to check for alerts after the run
}
2. Manual Checking with AlertChecker
You can manually check alerts using the AlertChecker component.
Summary
WASP provides flexibility in defining and monitoring NFRs:
- Use built-in alerts for standard metrics like p99, errors, and timeouts.
- Use custom alerts for complex conditions or Loki queries.
- Automate alert checks using
ProfilewithGrafanaOptsor manually verify them withAlertChecker.
By combining these tools, you can ensure your application's performance and reliability align with your NFRs.
WASP - How to Use Labels
The default WASP dashboard utilizes the following labels to differentiate between various generators and requests:
go_test_namegen_namebranchcommitcall_group
go_test_name
This label is used to differentiate between different tests. If an instance of *testing.T is passed to the generator configuration, the test name will automatically be added to the go_test_name label:
gen, err := wasp.NewGenerator(&wasp.Config{
    LoadType:   wasp.RPS,
    T:          t,                                  // < ----------------------- HERE
    Schedule:   wasp.Plain(5, 60*time.Second),
    Gun:        NewExampleHTTPGun(srv.URL()),
    Labels:     labels,
    LokiConfig: wasp.NewEnvLokiConfig(),
})
gen_name
This label differentiates between different generators:
gen, err := wasp.NewGenerator(&wasp.Config{
    LoadType:   wasp.RPS,
    T:          t,
    GenName:    "my_super_generator",                // < ----------------------- HERE
    Schedule:   wasp.Plain(5, 60*time.Second),
    Gun:        NewExampleHTTPGun(srv.URL()),
    Labels:     labels,
    LokiConfig: wasp.NewEnvLokiConfig(),
})
branch and commit
These labels are primarily used to distinguish between different branches and commits when running tests in CI.
Since there is no automated way to fetch this data, it must be passed manually:
branch := os.Getenv("BRANCH")
commit := os.Getenv("COMMIT")

labels := map[string]string{
    "branch":      branch,                       // < ----------------------- HERE
    "commit":      commit,                       // < ----------------------- HERE
}

gen, err := wasp.NewGenerator(&wasp.Config{
    LoadType:   wasp.RPS,
    T:          t,
    GenName:    "my_super_generator",
    Schedule:   wasp.Plain(5, 60*time.Second),
    Gun:        NewExampleHTTPGun(srv.URL()),
    Labels:     labels,                         // < ----------------------- HERE
    LokiConfig: wasp.NewEnvLokiConfig(),
})
note
Make sure to set the BRANCH and COMMIT environment variables in your CI workflow.
call_group
This label allows differentiation between different requests within a Virtual User's Call() function.
Example:
// represents user login
func (m *VirtualUser) requestOne(l *wasp.Generator) {
	var result map[string]interface{}
	r, err := m.client.R().
		SetResult(&result).
		Get(m.target)
	if err != nil {
		l.Responses.Err(r, "auth", err) // < ----------------------- HERE
		return
	}
	l.Responses.OK(r, "auth")         // < ----------------------- HERE
}

// represents authenticated user action
func (m *VirtualUser) requestTwo(l *wasp.Generator) {
    var result map[string]interface{}
    r, err := m.client.R().
        SetResult(&result).
        Get(m.target)
    if err != nil {
        l.Responses.Err(r, "user", err) // < ----------------------- HERE
        return
    }
    l.Responses.OK(r, "user")         // < ----------------------- HERE
}
In this example, the authentication request and the user action request are differentiated by the call_group label.
Custom Labels
note
You can add as many custom labels as needed for use with your dashboard.
labels := map[string]string{
    "custom_label_1": "value1",
    "custom_label_2": "value2",
}
WASP - How to Incorporate Load Tests in Your Workflow
You might be wondering where load tests belong in the Software Development Life Cycle (SDLC) and how to incorporate them effectively. The diagram below illustrates the recommended approach:
---
title: Workload execution. P - Profile, G - Generator, VU - VirtualUser
---
sequenceDiagram
    participant Product repo
    participant Runner
    participant K8s
    participant Loki
    participant Grafana
    participant Devs
    Product repo->>Product repo: Define NFR for different workloads<br/>Define application dashboard<br/>Define dashboard alerts<br/>Define load tests
    Product repo->>Grafana: Upload app dashboard<br/>Alerts have "requirement_name" label<br/>Each "requirement_name" group is based on some NFR
    loop CI runs
    Product repo->>Runner: CI runs small load test
    Runner->>Runner: Execute load test logic<br/>Run multiple generators
    Runner->>Loki: Stream load test data
    Runner->>Grafana: Check alerts for "requirement_name": "baseline"
    Grafana->>Devs: Notify devs (Dashboard URL/Alert groups)
    Product repo->>Runner: CI runs large load test
    Runner->>K8s: Split workload into multiple jobs<br/>Monitor job statuses
    K8s->>Loki: Stream load test data
    Runner->>Grafana: Check alerts for "requirement_name": "stress"
    Grafana->>Devs: Notify devs (Dashboard URL/Alert groups)
    end
Workflow Explanation
-
Define Requirements and Dashboards:
- Define NFRs (Non-Functional Requirements) for different workloads.
- Create an application dashboard and define alerts grouped by
requirement_name.
Eachrequirement_namegroup corresponds to a specific NFR.
-
Integrate into CI/CD:
- Small Load Tests:
Run small load tests as part of your CI pipeline:- Execute load test logic with multiple generators.
- Stream test data to Loki.
- Check Grafana alerts for the "baseline" group.
- Notify developers with dashboard URLs and alert group details.
- Large Load Tests:
For stress testing:- Split the workload into multiple Kubernetes jobs and monitor their statuses.
- Stream test data to Loki.
- Check Grafana alerts for the "stress" group.
- Notify developers with dashboard URLs and alert group details.
- Small Load Tests:
-
Notification and Iteration:
- Alerts notify developers about potential issues, directing them to relevant dashboards and alert groups.
Key Points
- Scalable Testing: Use small load tests for quick validation in CI and larger tests for stress validation.
- Real-Time Monitoring: Leverage Grafana to monitor metrics and alerts during test execution.
- Team Collaboration: Automate notifications to keep the team informed of any issues.
This approach ensures that load testing is seamlessly integrated into your SDLC and provides actionable insights for maintaining performance and reliability.
WASP - How to Reuse WASP Components in Your Own Dashboard
You can reuse components from the default WASP dashboard to build your custom dashboard. Here’s an example:
import (
    waspdashboard "github.com/smartcontractkit/wasp/dashboard"
    "github.com/K-Phoen/grabana/dashboard"
)

func BuildCustomLoadTestDashboard(dashboardName string) (dashboard.Builder, error) {
    // Custom key-value pairs used to query panels
    panelQuery := map[string]string{
        "branch":       `=~"${branch:pipe}"`,
        "commit":       `=~"${commit:pipe}"`,
        "network_type": `="testnet"`,
    }

    return dashboard.New(
        dashboardName,
        waspdashboard.WASPLoadStatsRow("Loki", panelQuery),      // WASP component
        waspdashboard.WASPDebugDataRow("Loki", panelQuery, true), // WASP component
        // Your custom panels and rows go here
    )
}
Available Components
You can find all reusable components in the following files:
Key Points
- WASP components like
WASPLoadStatsRowandWASPDebugDataRowcan be directly included in your dashboard. - Customize panel queries using key-value pairs specific to your setup.
- Extend the default dashboard by adding your own rows and panels alongside WASP components.
WASP - How to Parallelize Load
Parallelizing load can be achieved using the Profile component, which allows you to combine multiple generators. However, this approach works only if all generators start at the same time. If you need to space out the generators for various reasons, you must use native Go concurrency primitives like goroutines and channels.
Concept
To parallelize load:
- Split the load into multiple parts.
- Run each part in separate
goroutines, either using aProfileor directly withGenerator. - Use
channelsto coordinate the timing and synchronization between the goroutines.
Example Scenario
Suppose you want to execute the following scenario:
- Gradually ramp up an RPS load over 10 seconds from 1 to 10 RPS and hold it for 50 seconds.
- When RPS reaches 10, gradually ramp up a VU load over 16 seconds from 2 to 8 VUs (
VU') and hold it for 30 seconds. - Once
VU'reaches 8, introduce another user interaction and ramp up a VU load over 14 seconds from 3 to 9 VUs (VU'') and hold it for 20 seconds.
Here’s how you can achieve this:
func TestParallelLoad(t *testing.T) {
    labels := map[string]string{
        "branch": "parallel_load",
        "commit": "parallel_load",
    }

    // Define RPS schedule
    rpsSchedule := wasp.Combine(
		// wasp.Steps(from, increase, steps, duration)
        wasp.Steps(1, 1, 9, 10*time.Second), // Start with 1 RPS, increment by 1 RPS in 9 steps over 10 seconds
        // wasp.Plain(count, duration)
        wasp.Plain(9, 50*time.Second),       // Hold 9 RPS for 50 seconds
    )

    // Define VU' schedule
    vuSchedule := wasp.Combine(
        // wasp.Steps(from, increase, steps, duration)
        wasp.Steps(2, 1, 8, 16*time.Second), // Start with 2 VUs, increment by 1 VU in 8 steps over 16 seconds
        // wasp.Plain(count, duration)
        wasp.Plain(10, 30*time.Second),      // Hold 10 VUs for 30 seconds
    )

    // Define VU'' schedule
    vu2Schedule := wasp.Combine(
        // wasp.Steps(from, increase, steps, duration)
        wasp.Steps(3, 1, 6, 14*time.Second), // Start with 3 VUs, increment by 1 VU in 6 steps over 14 seconds
		// wasp.Plain(count, duration)
        wasp.Plain(9, 20*time.Second),       // Hold 9 VUs for 20 seconds
    )

    // Create generators
    rpsGen, err := wasp.NewGenerator(&wasp.Config{
        LoadType:   wasp.RPS,
        Schedule:   rpsSchedule,
        GenName:    "Kappa",
        Labels:     labels,
        Gun:        NewExampleHTTPGun(srv.URL()),
        LokiConfig: wasp.NewEnvLokiConfig(),
    })
    require.NoError(t, err)

    vuGen, err := wasp.NewGenerator(&wasp.Config{
        LoadType:   wasp.VU,
        Schedule:   vuSchedule,
        GenName:    "Lambda",
        Labels:     labels,
        VU:         NewExampleScenario(srv.URL()),
        LokiConfig: wasp.NewEnvLokiConfig(),
    })
    require.NoError(t, err)

    vu2Gen, err := wasp.NewGenerator(&wasp.Config{
        LoadType: wasp.VU,
        Schedule: vu2Schedule,
        GenName:  "Mu",
        Labels:   labels,
        VU:       NewExampleScenario(srv.URL()), // Use the same VirtualUser implementation for simplicity
        LokiConfig: wasp.NewEnvLokiConfig(),
    })
    require.NoError(t, err)

    wg := sync.WaitGroup{}

    // Run RPS load in a separate goroutine
    go func() {
        wg.Add(1)
        rpsGen.Run(true)
        wg.Done()
    }()

    // Wait for RPS load to stabilize
    time.Sleep(10 * time.Second)

    // Run VU' load in a separate goroutine
    go func() {
        wg.Add(1)
        vuGen.Run(true)
        wg.Done()
    }()

    // Wait for VU' load to stabilize
    time.Sleep(16 * time.Second)

    // Run VU'' load
    vu2Gen.Run(true)

    // Wait for all goroutines to complete
    wg.Wait()

    // Check for load generation errors
    require.Equal(t, 0, len(rpsGen.Errors()), "RPS generator errors")
    require.Equal(t, 0, len(vuGen.Errors()), "VU generator errors")
    require.Equal(t, 0, len(vu2Gen.Errors()), "VU'' generator errors")
}
Key Points
- Parallel Execution: Run each generator in its own
goroutine. - Synchronization: Use
time.Sleepor channels to coordinate timing between load segments. - Error Handling: Always check for errors in load generation, though they may not necessarily indicate a problem (e.g., aggressive load tests).
Full Example
For a complete example, refer to this file.
WASP - How to Debug Loki Push Errors
To troubleshoot Loki push errors, follow these steps:
Step 1: Enable Trace Logging
Set the logging level to trace to see all messages sent to Loki:
WASP_LOG_LEVEL=trace
Step 2: Adjust Error Limits
If the Loki client fails to deliver a batch, the test will continue until the maximum number of errors is reached.
You can control this using LokiConfig.MaxErrors:
- Set
LokiConfig.MaxErrorsto a desired limit. - Set it to
-1to disable error checks entirely.
Often, simply increasing LokiConfig.Timeout can resolve the issue.
Step 3: Handle Specific Errors
If you encounter errors like the following:
ERR Malformed promtail log message, skipping Line=["level",{},"component","client","host","...","msg","batch add err","tenant","","error",{}]
Take the following actions:
- Increase
LokiConfig.MaxStreams. - Verify the validity of your Loki configuration.
Since LokiConfig is specific for each Generator remember to adjust the configuration for all of your generators.
By following these steps, you can effectively debug and resolve Loki push errors.
Seth
Reliable and debug-friendly Ethereum client


Content
- Goals
- Features
- Examples
- Setup
- Configuration
- Automated gas price estimation
- DOT Graphs of transactions
- Using multiple private keys
- Experimental features
- Gas bumping for slow transactions
- CLI
- Manual gas price estimation
- Block Stats
- Single transaction tracing
- Bulk transaction tracing
- RPC traffic logging
- Read-only mode
- ABI Finder
- Contract Map
- Contract Store
Goals
- Be a thin, debuggable and battle tested wrapper on top of
go-ethereum - Decode all transaction inputs/outputs/logs for all ABIs you are working with, automatically
- Simple synchronous API
- Do not handle
nonceson the client side, trust the server - Do not wrap
bindgenerated contracts, small set of additional debug API - Resilient: should execute transactions even if there is a gas spike or an RPC outage (failover)
- Well tested: should provide a suite of e2e tests that can be run on testnets to check integration
Features
- Decode named inputs
- Decode named outputs
- Decode anonymous outputs
- Decode logs
- Decode indexed logs
- Decode old string reverts
- Decode new typed reverts
- EIP-1559 support
- Multi-keys client support
- CLI to manipulate test keys
- Simple manual gas price estimation
- Fail over client logic
- Decode collided event hashes
- Tracing support (4byte)
- Tracing support (callTracer)
- Tracing support (prestate)
- Tracing decoding
- Tracing tests
- More tests for corner cases of decoding/tracing
-
Saving of deployed contracts mapping (
address -> ABI_name) for live networks - Reading of deployed contracts mappings for live networks
- Automatic gas estimator (experimental)
- Block stats CLI
- Check if address has a pending nonce (transaction) and panic if it does
- DOT graph output for tracing
- Gas bumping for slow transactions
You can read more about how ABI finding and contract map works here and about contract store here here.
Examples
Check examples folder
Lib provides a small amount of helpers for decoding handling that you can use with vanilla go-ethereum generated wrappers
// Decode waits for transaction and decode all the data/errors
Decode(tx *types.Transaction, txErr error) (*DecodedTransaction, error)

// NewTXOpts returns a new sequential transaction options wrapper,
// sets opts.GasPrice and opts.GasLimit from seth.toml or override with options
NewTXOpts(o ...TransactOpt) *bind.TransactOpts

// NewCallOpts returns a new call options wrapper
NewCallOpts(o ...CallOpt) *bind.CallOpts
By default, we are using the root key 0, but you can also use any of the private keys passed as part of Network configuration in seth.toml or ephemeral keys.
// NewCallKeyOpts returns a new sequential call options wrapper from the key N
NewCallKeyOpts(keyNum int, o ...CallOpt) *bind.CallOpts

// NewTXKeyOpts returns a new transaction options wrapper called from the key N
NewTXKeyOpts(keyNum int, o ...TransactOpt) *bind.TransactOpts
Start Geth in a separate terminal, then run the examples
make GethSync
cd examples
go test -v
Setup
We are using nix
Enter the shell
nix develop
Building test contracts
We have go-ethereum and foundry tools inside nix shell
make build
Testing
To run tests on a local network, first start it
make AnvilSync
Or use latest Geth
make GethSync
You can use default hardhat key ac0974bec39a17e36ba4a6b4d238ff944bacb478cbed5efcae784d7bf4f2ff80 to run tests
Run the decode tests
make network=Anvil root_private_key=ac0974bec39a17e36ba4a6b4d238ff944bacb478cbed5efcae784d7bf4f2ff80 test
make network=Geth root_private_key=ac0974bec39a17e36ba4a6b4d238ff944bacb478cbed5efcae784d7bf4f2ff80 test
Check other params in seth.toml, select any network and use your key for testnets
User facing API tests are here
make network=Anvil root_private_key=ac0974bec39a17e36ba4a6b4d238ff944bacb478cbed5efcae784d7bf4f2ff80 test_api
make network=Geth root_private_key=ac0974bec39a17e36ba4a6b4d238ff944bacb478cbed5efcae784d7bf4f2ff80 test_api
CLI tests
make network=Anvil root_private_key=ac0974bec39a17e36ba4a6b4d238ff944bacb478cbed5efcae784d7bf4f2ff80 test_cli
make network=Geth root_private_key=ac0974bec39a17e36ba4a6b4d238ff944bacb478cbed5efcae784d7bf4f2ff80 test_cli
Tracing tests
make network=Anvil root_private_key=ac0974bec39a17e36ba4a6b4d238ff944bacb478cbed5efcae784d7bf4f2ff80 test_trace
make network=Geth root_private_key=ac0974bec39a17e36ba4a6b4d238ff944bacb478cbed5efcae784d7bf4f2ff80 test_trace
Config
Simplified configuration
If you do not want to set all the parameters, you can use a simplified progammatical configuration. Here's an example:
cfg := seth.DefaultConfig("ws://localhost:8546", []string{"ac0974bec39a17e36ba4a6b4d238ff944bacb478cbed5efcae784d7bf4f2ff80"})
client, err := seth.NewClientWithConfig(cfg)
if err != nil {
    log.Fatal(err)
}
This config uses what we consider reasonable defaults, such as:
- 5 minute transaction confirmation timeout
- 1 minute RPC node dial timeout
- enabled EIP-1559 dynamic fees and automatic gas prices estimation (with 200 blocks history; will auto-disable itself if RPC doesn't support EIP-1559)
- tracing only of reverted transaction to console and DOT graphs
- checking of RPC node health on client creation
- no ephemeral keys
ClientBuilder
You can also use a ClientBuilder to build a config programmatically. Here's an extensive example:
client, err := NewClientBuilder().
    // network
    WithNetworkName("my network").
	// if empty we will ask the RPC node for the chain ID
	WithNetworkChainId(1337).
    WithRpcUrl("ws://localhost:8546").
    WithPrivateKeys([]string{"ac0974bec39a17e36ba4a6b4d238ff944bacb478cbed5efcae784d7bf4f2ff80"}).
    WithRpcDialTimeout(10*time.Second).
    WithTransactionTimeouts(1*time.Minute).
    // addresses
    WithEphemeralAddresses(10, 10).
    // tracing
    WithTracing(seth.TracingLevel_All, []string{seth.TraceOutput_Console}).
    // protections
    WithProtections(true, true, seth.MustMakeDuration(2*time.Minute)).
    // artifacts folder
    WithArtifactsFolder("some_folder").
	// folder with gethwrappers for ABI decoding
    WithGethWrappersFolders([]string{"./gethwrappers/ccip", "./gethwrappers/keystone"}).
    // nonce manager
    WithNonceManager(10, 3, 60, 5).
    // EIP-1559 and gas estimations
    WithEIP1559DynamicFees(true).
    WithDynamicGasPrices(120_000_000_000, 44_000_000_000).
    // estimate gas prices based on the information from the RPC based on 10 last blocks
    // adjust the value to fast priority and 3 attempts to get the estimations
    WithGasPriceEstimations(true, 10, seth.Priority_Fast, 3).
    // gas bumping: retries, max gas price, bumping strategy function
    WithGasBumping(5, 100_000_000_000, PriorityBasedGasBumpingStrategyFn).
    Build()

if err != nil {
    log.Fatal(err)
}
By default, it uses the same values as simplified configuration, but you can override them by calling the appropriate methods. Builder includes only options
that we thought to be most useful, it's not a 1:1 mapping of all fields in the Config struct. Therefore, if you need to set some more advanced options, you should create the Config struct directly,
use TOML config or manually set the fields on the Config struct returned by the builder.
It' also possible to use the builder to create a new config from an existing one:
client, err := NewClientBuilderWithConfig(&existingConfig).
        UseNetworkWithChainId(1337).
        WithEIP1559DynamicFees(false).
	    Build()

if err != nil {
    log.Fatal(err)
}
This can be useful if you already have a config, but want to modify it slightly. This approach will only work if you pass it the full config, since it will not apply any defaults. It can also be useful if you read TOML config with multiple Networks and you want to specify which one you want to use. Although for that use case it's better to make use of the following approach:
// assuming that "readSethNetworks" knows how to read the TOML file and convert it to []*seth.Network
/* example content of networks.toml:
[[networks]]
name = "Anvil"
dial_timeout = "1m"
transaction_timeout = "30s"
urls_secret = ["ws://localhost:8545"]
transfer_gas_fee = 21_000
gas_limit = 10_000_000
# legacy transactions
gas_price = 1_000_000_000
# EIP-1559 transactions
# disabled as it makes some of our tests fail
# eip_1559_dynamic_fees = true
gas_fee_cap = 1_000_000_000
gas_tip_cap = 1_000_000_000

[[networks]]
name = "Geth"
dial_timeout = "1m"
transaction_timeout = "30s"
urls_secret = ["ws://localhost:8546"]
transfer_gas_fee = 21_000
gas_limit = 8_000_000
# legacy transactions
gas_price = 1_000_000_000
# EIP-1559 transactions
# disabled as it makes some of our tests fail
# eip_1559_dynamic_fees = true
gas_fee_cap = 10_000_000_000
gas_tip_cap = 3_000_000_000
*/
networks, err := readSethNetworks("networks.toml")
if err != nil {
    log.Fatal(err)
}

client, err := NewClientBuilderWithConfig(&existingConfig).
        UseNetworkWithName("Anvil"). // or alternatively use UseNetworkWithChainId (if you defined it for you network)
	    Build()

if err != nil {
    log.Fatal(err)
}
Simulated Backend
Last, but not least, ClientBuilder allows you to pass custom implementation of simulated.Client interface, which include Geth's Simulated Backend, which might be very useful for rapid testing against
in-memory environment. When using that option bear in mind that:
- passing RPC URL is not allowed and will result in error
- tracing is disabled
note
Simulated Backend doesn't support tracing, because it doesn't expose the JSON-RPC Call(result interface{}, method string, args ...interface{}) method, which we use to fetch debug information.
So how do you use Seth with simulated backend?
var startBackend := func(fundedAddresses []common.Address) (*simulated.Backend, context.CancelFunc) {
toFund := make(map[common.Address]types.Account)
	for _, address := range fundedAddresses {
		toFund[address] = types.Account{
			Balance: big.NewInt(1000000000000000000), // 1 Ether
		}
	}
	backend := simulated.NewBackend(toFund)

	ctx, cancelFn := context.WithCancel(context.Background())

    // 100ms block time
	ticker := time.NewTicker(100 * time.Millisecond)
	go func() {
		for {
			select {
			case <-ticker.C:
				backend.Commit()
			case <-ctx.Done():
				backend.Close()
				return
			}
		}
	}()

	return backend, cancelFn
}

// 0xf39fd6e51aad88f6f4ce6ab8827279cfffb92266 is the default dev account
backend, cancelFn := startBackend(
    []common.Address{common.HexToAddress("0xf39fd6e51aad88f6f4ce6ab8827279cfffb92266")},
)
defer func() { cancelFn() }()

client, err := builder.
    WithNetworkName("simulated").
    WithEthClient(backend.Client()).
    WithPrivateKeys([]string{"ac0974bec39a17e36ba4a6b4d238ff944bacb478cbed5efcae784d7bf4f2ff80"}).
    Build()

require.NoError(t, err, "failed to build client")
_ = client
warning
When using simulated.Backend do remember that it doesn't automatically mine blocks. You need to call backend.Commit() manually
to mine a new block and have your transactions processed. The best way to do it is having a goroutine running in the background
that either mines at specific intervals or when it receives a message on channel.
Hooks
Seth supports pre/post operation hooks for two functions:
DeployContract()Decode(alsoDecodeTx)
As the name suggest each will be executed before and after mentioned operation. By default, no hooks are set. Adding hooks doesn't influence retry/gas bumping logic.
You can either set hooks directly on the seth.Config object (not recommended) or pass them to the ClientBuilder:
// assuming backend is the simulated backend, to show how we can speed up contract deployments by calling `Commit()` right after deploying the contract
hooks := seth.Hooks{
    ContractDeployment: seth.ContractDeploymentHooks{
        Post: func(client *seth.Client, tx *types.Transaction) error {
            backend.Commit()
            return nil
        },
    },
}

client, err := builder.
    WithNetworkName("simulated").
    WithHooks(hooks).
    WithEthClient(backend.Client()).
    WithPrivateKeys([]string{"ac0974bec39a17e36ba4a6b4d238ff944bacb478cbed5efcae784d7bf4f2ff80"}).
    Build()

if err != nil {
    log.Fatal(err)
}
Supported env vars
Some crucial data is stored in env vars, create .envrc and use source .envrc, or use direnv
export SETH_LOG_LEVEL=info # global logger level
export SETH_CONFIG_PATH=seth.toml # path to the toml config
export SETH_NETWORK=Geth # selected network
export SETH_ROOT_PRIVATE_KEY=ac0974bec39a17e36ba4a6b4d238ff944bacb478cbed5efcae784d7bf4f2ff80 # root private key

alias seth="SETH_CONFIG_PATH=seth.toml go run cmd/seth/seth.go" # useful alias for CLI
Find the log level options here
Alternatively if you don't have a network defined in the TOML you can still use the CLI by providing these 2 key env vars:
export SETH_URL=https://rpc.fuji.testnet.anyswap.exchange
export SETH_CHAIN_ID=43113

go run cmd/seth/seth.go ... # your command
In that case you should still pass network name with -n flag.
TOML configuration
Set up your ABI directory (relative to seth.toml)
abi_dir = "contracts/abi"
Setup your BIN directory (relative to seth.toml)
bin_dir = "contracts/bin"
Decide whether you want to generate any ephemeral keys:
# Set number of ephemeral keys to be generated (0 for no ephemeral keys). Each key will receive a proportion of native tokens from root private key's balance with the value equal to `(root_balance / ephemeral_keys_number) - transfer_fee * ephemeral_keys_number`.
ephemeral_addresses_number = 10
You can enable auto-tracing for all transactions meeting configured level, which means that every time you use Decode() we will decode the transaction and also trace all calls made within the transaction, together with all inputs, outputs, logs and events. Three tracing levels are available:
all- trace all transactionsreverted- trace only reverted transactions (that's default setting used if you don't settracing_level)none- don't trace any transactions
Example:
tracing_level = "reverted"
Additionally, you can decide where tracing/decoding data goes to. There are three options:
console- we will print all tracing data to the consolejson- we will save tracing data for each transaction to a JSON filedot- we will save tracing data for each transaction to a DOT file (graph)
trace_outputs = ["console", "json", "dot"]
For info on viewing DOT files please check the DOT graphs section below.
Example:
 These two options should be used with care, when
 tracing_level is set to all as they might generate a lot of data.
If you want to check if the RPC is healthy on start, you can enable it with:
check_rpc_health_on_start = false
It will execute a simple check of transferring 10k wei from root key to root key and check if the transaction was successful.
You can also enable pending nonce protection that will check if given key has any pending transactions. By default, we will wait 1 minute for all transactions to be mined. If any of them is still pending, we will panic. You can enable it with:
pending_nonce_protection_enabled = true
pending_nonce_protection_timeout = "5m"
If you want to use HTTP instead of WS you can do so by setting to true:
force_http = false
You can add more networks like this:
[[Networks]]
name = "Fuji"
transaction_timeout = "30s"
# gas limit should be explicitly set only if you are connecting to a node that's incapable of estimating gas limit itself (should only happen for very old versions)
# gas_limit = 9_000_000
# hardcoded gas limit for sending funds that will be used if estimation of gas limit fails
transfer_gas_fee = 21_000
# legacy transactions
gas_price = 1_000_000_000
# EIP-1559 transactions
eip_1559_dynamic_fees = true
gas_fee_cap = 25_000_000_000
gas_tip_cap = 1_800_000_000
urls_secret = ["..."]
# if set to true we will dynamically estimate gas for every transaction (explained in more detail below)
gas_price_estimation_enabled = true
# how many last blocks to use, when estimating gas for a transaction
gas_price_estimation_blocks = 1000
# priority of the transaction, can be "fast", "standard" or "slow" (the higher the priority, the higher adjustment factor and buffer will be used for gas estimation) [default: "standard"]
gas_price_estimation_tx_priority = "slow"
If you don't we will use the default settings for Default network.
ChainID is not needed, as it's fetched from the node.
If you want to save addresses of deployed contracts, you can enable it with:
save_deployed_contracts_map = true
If you want to re-use previously deployed contracts you can indicate file name in seth.toml:
contract_map_file = "deployed_contracts_mumbai.toml"
Both features only work for live networks. Otherwise, they are ignored, and nothing is saved/read from for simulated networks.
Automatic Gas Estimator
This section explains how to configure and understand the automatic gas estimator, which is crucial for executing transactions on Ethereum-based networks. Here’s what you need to know:
Configuration Requirements
Before using the automatic gas estimator, it's essential to set the default gas-related parameters for your network:
- Non-EIP-1559 Networks: Set the
gas_priceto define the cost per unit of gas if your network doesn't support EIP-1559. - EIP-1559 Networks: If your network supports EIP-1559, set the following:
eip_1559_dynamic_fees: Enables dynamic fee structure.gas_fee_cap: The maximum fee you're willing to pay per gas.gas_tip_cap: An optional tip to prioritize your transaction within a block (although if it's set to0there's a high chance your transaction will take longer to execute as it will be less attractive to miners, so do set it).
These settings act as a fallback if the gas estimation fails. Additionally, always specify transfer_gas_fee for the fee associated with token transfers.
If you do not know if your network supports EIP-1559, but you want to give it a try it's recommended that you also set gas_price as a fallback. When we try to use EIP-1559 during gas price estimation, but it fails, we will fallback to using non-EIP-1559 logic. If that one fails as well, we will use hardcoded gas_price value.
How Gas Estimation Works
Gas estimation varies based on whether the network is a private Ethereum Network or a live network.
- Private Ethereum Networks: no estimation is needed. We always use hardcoded values.
For real networks, the estimation process differs for legacy transactions and those compliant with EIP-1559:
Legacy Transactions
Unless priority is set to auto, when we will defer to what the RPC node suggests, following logic is used:
- Initial Price: Query the network node for the current suggested gas price.
- Priority Adjustment: Modify the initial price based on
gas_price_estimation_tx_priority. Higher priority increases the price to ensure faster inclusion in a block. - Congestion Analysis: Examine the last X blocks (as specified by
gas_price_estimation_blocks) to determine network congestion, calculating the usage rate of gas in each block and giving recent blocks more weight. Disabled ifgas_price_estimation_blocksequals0. - Buffering: Add a buffer to the adjusted gas price to increase transaction reliability during high congestion.
EIP-1559 Transactions
Unless priority is set to auto, when we will defer to what the RPC node suggests, following logic is used:
- Tip Fee Query: Ask the node for the current recommended tip fee.
- Fee History Analysis: Gather the base fee and tip history from recent blocks to establish a fee baseline.
- Fee Selection: Use the greatest of the node's suggested tip or the historical average tip for upcoming calculations.
- Priority and Adjustment: Increase the base and tip fees based on transaction priority (
gas_price_estimation_tx_priority), which influences how much you are willing to spend to expedite your transaction. - Final Fee Calculation: Sum the base fee and adjusted tip to set the
gas_fee_cap. - Congestion Buffer: Similar to legacy transactions, analyze congestion and apply a buffer to both the fee cap and the tip to secure transaction inclusion.
Regardless of transaction type, if fetching data from RPC or calculating prices fails due to any issue and gas_price_estimation_attempt_count is > 1 we will retry it N-1 number of times.
Understanding and setting these parameters correctly ensures that your transactions are processed efficiently and cost-effectively on the network.
When fetching historical base fee and tip data, we will use the last gas_price_estimation_blocks blocks. If it's set to 0 we will default to 100 last blocks. If the blockchain has less than 100 blocks we will use all of them.
Finally, gas_price_estimation_tx_priority is also used, when deciding, which percentile to use for base fee and tip for historical fee data. Here's how that looks:
case Priority_Fast:
    baseFee = stats.GasPrice.Perc99
    historicalGasTipCap = stats.TipCap.Perc99
case Priority_Standard:
    baseFee = stats.GasPrice.Perc50
    historicalGasTipCap = stats.TipCap.Perc50
case Priority_Slow:
    baseFee = stats.GasPrice.Perc25
    historicalGasTipCap = stats.TipCap.Perc25
Adjustment factor
All values are multiplied by the adjustment factor, which is calculated based on gas_price_estimation_tx_priority:
case Priority_Fast:
    return 1.2
case Priority_Standard:
    return 1.0
case Priority_Slow:
    return 0.8
For fast transactions we will increase gas price by 20%, for standard we will use the value as is and for slow we will decrease it by 20%.
Buffer percents
If gas_price_estimation_blocks is higher than 0 we further adjust the gas price by adding a buffer to it, based on congestion rate:
case Congestion_Low:
    return 1.10, nil
case Congestion_Medium:
    return 1.20, nil
case Congestion_High:
    return 1.30, nil
case Congestion_VeryHigh:
    return 1.40, nil
For low congestion rate we will increase gas price by 10%, for medium by 20%, for high by 30% and for very high by 40%. We cache block header data in an in-memory cache, so we don't have to fetch it every time we estimate gas. The cache has capacity equal to gas_price_estimation_blocks and every time we add a new element, we remove one that is least frequently used and oldest (with block number being a constant and chain always moving forward it makes no sense to keep old blocks). It's important to know that in order to use congestion metrics we need to fetch at least 80% of the requested blocks. If that fails, we will skip this part of the estimation and only adjust the gas price based on priority.
For both transaction types if any of the steps fails, we fall back to hardcoded values.
Gas estimations attemps
If for any reason fetching gas price suggestions or fee history from the RPC fails, or subsequent calulation of percentiles fails, it can be retried. This behaviour is controlled by gas_price_estimation_attempt_count, which if empty or set to 0 will default to
just one attempt, which means that if it fails, it won't be retried. Set it to 2 to allow a single retry, etc.
note
To disable gas estimation set gas_price_estimation_enabled to false. Setting gas_price_estimation_attempt_count to 0 won't have such effect.
DOT graphs
There are multiple ways of visualising DOT graphs:
xdotapplication [recommended]- VSCode Extensions
- online viewers
xdot
To install simply run homebrew install xdot and then run xdot <path_to_dot_file>. This tool seems to be the best for the job, since the viewer is interactive and supports tooltips, which in our case contain extra tracing information.
VSCode Extensions
There are multiple extensions that can be used to view DOT files in VSCode. We recommend using Graphviz Preview. The downside is that it doesn't support tooltips.
Goland
We were unable to find any (working) plugins for DOT graph visualization. If you do know any, please let us know.
Online viewers
There's at least a dozen of them available, but none of them support tooltips and most can't handle our multi-line labels. These two are known to work, though:
Using multiple keys
If you want to use existing multiple keys (instead of ephemeral ones) you can pass them as part of the network configuration. In that case it's recommended to not read them from TOML file. If you need to read them for the filesystem/os it's best if you use environment variables.
Once you've read them in a safe manner you should programmatically add them to Seth's Config struct (which safe parts can be read from TOML file). You can either add them directly to Network, if it's already set up, or you can add them to Networks slice to the network you intend to use.
For example you could start by reading the TOML configuration first:
cfg, err := seth.ReadCfg()
if err != nil {
    log.Fatal(err)
}
Then read the private keys in a safe manner. For example from a secure vault or environment variables:
var privateKeys []string
var err error
privateKeys, err = some_utils.ReadPrivateKeysFromEnv()
if err != nil {
    log.Fatal(err)
}
and then add them to the Network you plan to use. Let's assume it's called Sepolia:
for i, network := range cfg.Networks {
    if network.Name == "Sepolia" {
        cfg.Networks[i].PrivateKeys = privateKeys
    }
}
Or if you aren't using [[Networks]] in your TOML config and have just a single Network:
cfg.Network.PrivateKeys = privateKeys
Or... you can use the convenience function AppendPksToNetwork() to have them added to both the Network and Networks slice:
added := cfg.AppendPksToNetwork(privateKeys, "Sepolia")
if !added {
    log.Fatal("Network Sepolia not found in the config")
}
Finally, proceed to create a new Seth instance:
seth, err := seth.NewClientWithConfig(cfg)
if err != nil {
    log.Fatal(err)
}
A working example can be found here as TestSmokeExampleMultiKeyFromEnv test.
Currently, there's no safe way to pass multiple keys to CLI. In that case TOML is the only way to go, but you should be mindful that if you commit the TOML file with keys in it, you should assume they are compromised and all funds on them are lost.
Experimental features
In order to enable an experimental feature you need to pass its name in config. It's a global config, you cannot enable it per-network. Example:
# other settings before...
tracing_level = "reverted"
trace_outputs = ["console"]
experiments_enabled = ["slow_funds_return", "eip_1559_fee_equalizer"]
Here's what they do:
slow_funds_returnwill work only incoreand when enabled it changes tx priority toslowand increases transaction timeout to 30 minutes.eip_1559_fee_equalizerin case of EIP-1559 transactions if it detects that historical base fee and suggested/historical tip are more than 3 orders of magnitude apart, it will use the higher value for both (this helps in cases where base fee is almost 0 and transaction is never processed).
Gas bumping for slow transactions
Seth has built-in gas bumping mechanism for slow transactions. If a transaction is not mined within a certain time frame (Network's transaction timeout), Seth will automatically bump the gas price and resubmit the transaction. This feature is disabled by default and can be enabled by setting the [gas_bumps] retries to a non-zero number:
[gas_bumps]
retries = 5
Once enabled, by default the amount, by which gas price is bumped depends on gas_price_estimation_tx_priority setting and is calculated as follows:
Priority_Fast: 30% increasePriority_Standard: 15% increasePriority_Slow: 5% increase- everything else: no increase
You can cap max gas price by settings (in wei):
[gas_bumps]
max_gas_price = 1000000000000
Once the gas price bump would go above the limit we stop bumping and use the last gas price that was below the limit.
How gas price is calculated depends on transaction type:
- for legacy transactions it's just the gas price
- for EIP-1559 transactions it's the sum of gas fee cap and tip cap
- for Blob transactions (EIP-4844) it's the sum of gas fee cap and tip cap and max fee per blob
- for AccessList transactions (EIP-2930) it's just the gas price
Please note that Blob and AccessList support remains experimental and is not tested.
If you want to use a custom bumping strategy, you can use a function with GasBumpStrategyFn type. Here's an example of a custom strategy that bumps the gas price by 100% for every retry:
var customGasBumpStrategyFn = func(gasPrice *big.Int) *big.Int {
    return new(big.Int).Mul(gasPrice, big.NewInt(2))
}
To use this strategy, you need to pass it to the WithGasBumping function in the ClientBuilder:
var hundredGwei in64 = 100_000_000_000
client, err := builder.
    // other settings...
    WithGasBumping(5, hundredGwei, customGasBumpStrategyFn).
    Build()
Or set it directly on Seth's config:
// assuming sethClient is already created
sethClient.Config.GasBumps.StrategyFn = customGasBumpStrategyFn
Since strategy function only accepts a single parameter, if you want to base its behaviour on anything else than that you will need to capture these values from the context, in which you define the strategy function. For example, you can use a closure to capture the initial gas price:
gasOracleClient := NewGasOracleClient()

var oracleGasBumpStrategyFn = func(gasPrice *big.Int) *big.Int {
    // get the current gas price from the oracle
    suggestedGasPrice := gasOracleClient.GetCurrentGasPrice()

	// if oracle suggests a higher gas price, use it
    if suggestedGasPrice.Cmp(gasPrice) == 1 {
        return suggestedGasPrice
    }

	// otherwise bump by 100%
    return new(big.Int).Mul(gasPrice, big.NewInt(2))
}
Same strategy is applied to all types of transactions, regardless whether it's gas price, gas fee cap, gas tip cap or max blob fee.
When enabled, gas bumping is used in two places:
- during contract deployment via
DeployContractfunction - inside
Decode()function
It is recommended to decrease transaction timeout when using gas bumping, as it will be effectively increased by the number of retries. So if you were running with 5 minutes timeout and 0 retries, you should set it to 1 minute and 5 retries or 30 seconds and 10 retries.
Don't worry if while bumping logic executes previous transaction gets mined. In that case sending replacement transaction with higher gas will fail (because it is using the same nonce as original transaction) and we will retry waiting for the mining of the original transaction.
Gas bumping is only applied for submitted transaction. If transaction was rejected by the node (e.g. because of too low base fee) we will not bump the gas price nor try to submit it, because original transaction submission happens outside of Seth.
CLI
You can either define the network you want to interact with in your TOML config and then refer it in the CLI command, or you can pass all network parameters via env vars. Most of the examples below show how to use the former approach.
Manual gas price estimation
In order to adjust gas price for a transaction, you can use seth gas command
seth -n Fuji gas -b 10000 -tp 0.99
This will analyze last 10k blocks and give you 25/50/75/99th/Max percentiles for base fees and tip fees
-tp 0.99 requests the 99th tip percentile across all the transaction in one block and calculates 25/50/75/99th/Max across all blocks
Block Stats
If you need to get some insights into network stats and create a realistic load/chaos profile with simulators (anvil as an example), you can use stats CLI command
Define your network in seth.toml
Edit your seth.toml
[[networks]]
name = "MyCustomNetwork"
urls_secret = ["..."]

[block_stats]
rpc_requests_per_second_limit = 5
Then check the stats for the last N blocks
seth -n MyCustomNetwork stats -s -10
To check stats for the interval (A, B)
seth -n MyCustomNetwork stats -s A -e B
Pass all network parameters via env vars
If you don't have a network defined in the TOML you can still use the CLI by providing the RPC url via cmd arg.
Then check the stats for the last N blocks
seth -u "https://my-rpc.network.io" stats -s -10
To check stats for the interval (A, B)
seth -u "https://my-rpc.network.io" stats -s A -e B
Results can help you to understand if network is stable, what is avg block time, gas price, block utilization and transactions per second.
# Stats
perc_95_tps = 8.0
perc_95_block_duration = '3s'
perc_95_block_gas_used = 1305450
perc_95_block_gas_limit = 15000000
perc_95_block_base_fee = 25000000000
avg_tps = 2.433333333333333
avg_block_duration = '2s'
avg_block_gas_used = 493233
avg_block_gas_limit = 15000000
avg_block_base_fee = 25000000000

# Recommended performance/chaos test parameters
duration = '2m0s'
block_gas_base_fee_initial_value = 25000000000
block_gas_base_fee_bump_percentage = '100.00% (no bump required)'
block_gas_usage_percentage = '3.28822000% gas used (no congestion)'
avg_tps = 3.0
max_tps = 8.0
Single transaction tracing
You can trace a single transaction using seth trace command. Example with seth alias mentioned before:
seth -u "https://my-rpc.network.io" trace -t 0x4c21294bf4c0a19de16e0fca74e1ea1687ba96c3cab64f6fca5640fb7b84df65
or if you want to use a predefined-network:
seth -n=Geth trace -t 0x4c21294bf4c0a19de16e0fca74e1ea1687ba96c3cab64f6fca5640fb7b84df65
Bulk transaction tracing
You can trace multiple transactions at once using seth trace command for a predefined network named Geth. Example:
seth -n=Geth trace -f reverted_transactions.json
or by passing all the RPC parameter with a flag:
seth -u "https://my-rpc.network.io" trace -f reverted_transactions.json
You need to pass a file with a list of transaction hashes to trace. The file should be a JSON array of transaction hashes, like this:
[
  "0x...",
  "0x...",
  "0x...",
  ...
]
(Note that currently Seth automatically creates reverted_transactions_<network>_<date>.json with all reverted transactions, so you can use this file as input for the trace command.)
RPC Traffic logging
With SETH_LOG_LEVEL=trace we will also log to console all traffic between Seth and RPC node. This can be useful for debugging as you can see all the requests and responses.
Read-only mode
It's possible to use Seth in read-only mode only for transaction confirmation and tracing. Following operations will fail:
- contract deployment (we need a pk to sign the transaction)
- new transaction options (we need the pk/address to check nonce)
- RPC health check (we need a pk to send a transaction to ourselves)
- pending nonce protection (we need an address to check pending transactions)
- ephemeral keys (we need a pk to fund them)
- gas bumping (we need a pk to sign the transaction)
The easiest way to enable read-only mode is to client via ClientBuilder:
	client, err := builder.
		WithNetworkName("my network").
		WithRpcUrl("ws://localhost:8546").
		WithEphemeralAddresses(10, 1000).
		WithPrivateKeys([]string{"ac0974bec39a17e36ba4a6b4d238ff944bacb478cbed5efcae784d7bf4f2ff80"}).
		WithReadOnlyMode().
		Build()
when builder is called with WithReadOnlyMode() it will disable all the operations mentioned above and all the configuration settings related to them.
Additionally, when the client is build anc cfg.ReadOnly = true is set, we will validate that:
- no addresses and private keys are passed
- no ephemeral addresses are to be created
- RPC health check is disabled
- pending nonce protection is disabled
- gas bumping is disabled
ABI Finder
In order to be able to decode and trace transactions and calls between smart contracts we need their ABIs. Unfortunately, it might happen that two or more contracts have methods with the same signatures, which might result in incorrect tracing. To make that problem less severe we have decided to add a single point of entry for contract deployment in Seth to track what contract is deployed at which address and thus minimise incorrect tracing due to potentially ambiguous method signatures.
There are two possible starting points:
-
We don’t know what contract (ABI) is located at a given address. That is the case, when the contract either wasn’t uploaded via Seth or we haven’t supplied Seth with a contract map as part of its configuration (more on that later).
a. We sequentially iterate over all known ABIs (map:
name -> ABI_name) checking whether it has a method with a given signature. Once we get a first match we upsert that (address -> ABI_name) data into the contract map and return the ABI.The caveat here is that if the method we are searching for is present in more than one ABI we might associate the address with an incorrect address (we use the first match).b. If no match is found we return an error.
-
We know what ABI is located at a given address. That is the case, when we have either uploaded the contract via Seth, provided Seth with a contract map or already traced a transaction to that address and found an ABI with matching method signature.
a. We fetch the corresponding ABI and check if it indeed contains the method we are looking for (as mentioned earlier in some cases it might not be the case, because we associated the ABI with address using a different method that it shared with some other contract).
b. If it does, we return the ABI.
c. If it doesn’t we iterate again over all known ABIs, in the same way as in
1a. If we find a match we update the (address -> ABI_name) association in the contract map and return the ABI.It is possible that this will happen multiple times, if we have multiple contracts with multiple identical methods, but given a sufficiently diverse set of methods that were called we should eventually arrive at a fully correct contract map.d. If no match is found we will return an error.
Example
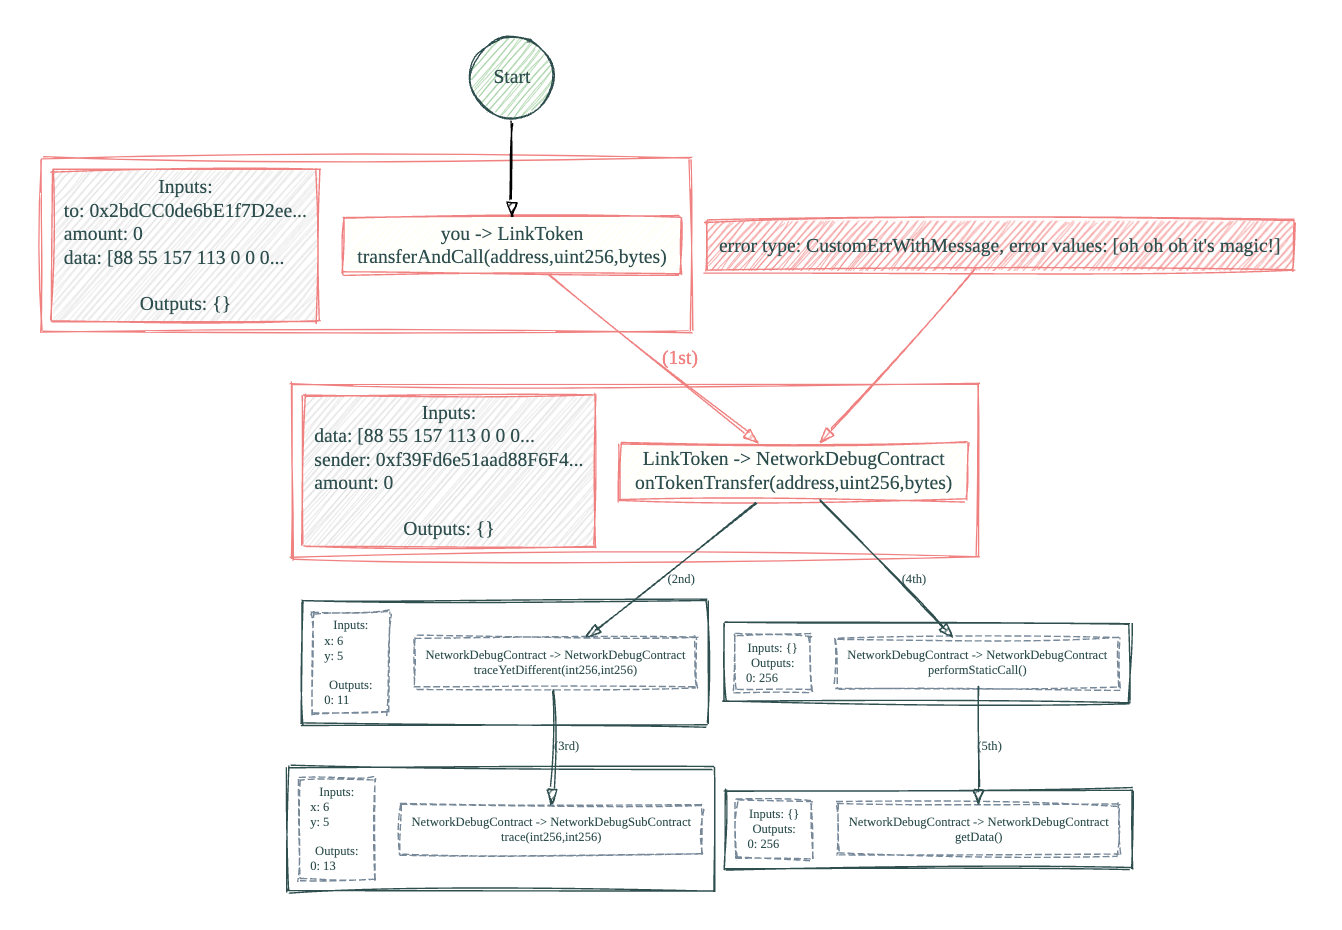
Contract Map
We support in-memory contract map and a TOML file-based one that keeps the association of (address -> ABI_name). The latter map is only used for non-simulated networks. Every time we deploy a contract we save (address -> ABI_name) entry in the in-memory map. If the network is not a simulated one we also save it in a file. That file can later be pointed to in Seth configuration and we will load the contract map from it (currently without validating whether we have all the ABIs mentioned in the file).
When saving contract deployment information we can either generate filename for you (if you didn’t configure Seth to use a particular file) using the pattern of deployed_contracts_${network_name}_${timestamp}.toml or use the filename provided in Seth TOML configuration file.
It has to be noted that the file-based contract map is currently updated only, when new contracts are deployed. There’s no mechanism for updating it if we found the mapping invalid (which might be the case if you manually created the entry in the file).
Contract Store
Contract store is a component that stores ABIs and contracts' bytecodes. In theory, Seth can be used without it, but it would have very limited usage as transaction decoding and tracing cannot work without ABIs. Thus in practice, we enforce a non-empty Contract Store durin Seth initialisation.
Another use of Contract Store is simplified contract deployment. For that we also need the contract's bytecode. The contract store can be used to store the bytecode of the contract and then deploy it using the DeployContractFromContractStore(auth *bind.TransactOpts, name string, backend bind.ContractBackend, params ...interface{}) method. When Seth is intialisied with the contract store and no bytecode files (*.bin) are provided, it will log a warning, but initialise successfully nonetheless.
If bytecode file wasn't provided, you need to use DeployContract(auth *bind.TransactOpts, name string, abi abi.ABI, bytecode []byte, backend bind.ContractBackend, params ...interface{}) method, which expects you to provide contract name (best if equal to the name of the ABI file), bytecode and the ABI.
Sentinel
🚧 Beta Notice: Sentinel is currently in Beta mode. The API is subject to change, and users are advised to stay updated with the latest releases and documentation.
Table of Contents
Overview
Sentinel is a centralized orchestrator that manages multiple blockchain poller services, each responsible for a specific blockchain network (e.g., Ethereum, Optimism, Arbitrum). It provides a unified interface for subscribing to blockchain events, ensuring efficient log polling and event broadcasting to subscribers.
Key Features
- Multi-Chain Support: Manage multiple blockchain networks concurrently.
- Event Broadcasting: Relay blockchain events to subscribers via a thread-safe subscription system.
- Flexible Subscriptions: Dynamically subscribe and unsubscribe to events based on addresses and topics.
- Graceful Lifecycle Management: Start, stop, and clean up resources across services effortlessly.
- Comprehensive Testing: Ensures reliability through extensive unit and integration tests.
- Scalable Architecture: Designed to handle polling multiple chains with multiple users subscribed to multiple events.
System Architecture
How Components Interact
graph TD
    Sentinel["Sentinel<br/>(Coordinator)"]

    subgraph Ethereum
        ChainPollerSvc_Ethereum["ChainPollerSvc<br/>(Ethereum)"]
        ChainPoller_Ethereum["ChainPoller<br/>(Log Fetching)"]
        SubscriptionManager_Ethereum["Subscription Manager"]
        ChainPollerSvc_Ethereum --> ChainPoller_Ethereum
        ChainPollerSvc_Ethereum --> SubscriptionManager_Ethereum
        ChainPoller_Ethereum --> Blockchain_Ethereum["Blockchain<br/>(Ethereum)"]
    end

    subgraph Polygon
        ChainPollerSvc_Polygon["ChainPollerSvc<br/>(Polygon)"]
        ChainPoller_Polygon["ChainPoller<br/>(Log Fetching)"]
        SubscriptionManager_Polygon["Subscription Manager"]
        ChainPollerSvc_Polygon --> ChainPoller_Polygon
        ChainPollerSvc_Polygon --> SubscriptionManager_Polygon
        ChainPoller_Polygon --> Blockchain_Polygon["Blockchain<br/>(Polygon)"]
    end

    subgraph Arbitrum
        ChainPollerSvc_Arbitrum["ChainPollerSvc<br/>(Arbitrum)"]
        ChainPoller_Arbitrum["ChainPoller<br/>(Log Fetching)"]
        SubscriptionManager_Arbitrum["Subscription Manager"]
        ChainPollerSvc_Arbitrum --> ChainPoller_Arbitrum
        ChainPollerSvc_Arbitrum --> SubscriptionManager_Arbitrum
        ChainPoller_Arbitrum --> Blockchain_Arbitrum["Blockchain<br/>(Arbitrum)"]
    end

    Sentinel --> Ethereum
    Sentinel --> Polygon
    Sentinel --> Arbitrum
Core Components
-
Sentinel:
- Role: Central coordinator managing multiple
ChainPollerServiceinstances. - Visibility: External
- Responsibilities:
- Handles adding and removing blockchain chains.
- Manages global subscriptions.
- Orchestrates communication between components.
- Role: Central coordinator managing multiple
-
ChainPollerService:
- Role: Manages the polling process for a specific blockchain.
- Visibility: Internal
- Responsibilities:
- Polls blockchain logs based on filter queries.
- Integrates internal
ChainPollerandSubscriptionManager. - Broadcasts fetched logs to relevant subscribers.
-
ChainPoller:
- Role: Fetches logs from blockchain networks.
- Visibility: Internal
- Responsibilities:
- Interacts with the blockchain client to retrieve logs.
- Processes filter queries to fetch relevant logs.
-
SubscriptionManager:
- Role: Manages event subscriptions for a specific chain.
- Visibility: Internal
- Responsibilities:
- Tracks subscriptions to blockchain events.
- Ensures thread-safe management of subscribers.
- Broadcasts logs to all relevant subscribers.
Usage
Initialize Sentinel
Set up a Sentinel instance:
package main

import (
    "github.com/rs/zerolog"
    "os"

    "github.com/smartcontractkit/chainlink-testing-framework/sentinel"
)

func main() {
    // Initialize logger
    logger := zerolog.New(os.Stdout).With().Timestamp().Logger()

    // Initialize Sentinel
    sentinelCoordinator := sentinel.NewSentinel(sentinel.SentinelConfig{
        Logger: &logger,
    })
    defer sentinelCoordinator.Close()
}
Add a Chain
Add a blockchain to monitor:
package main

import (
    "time"

    "github.com/ethereum/go-ethereum/ethclient"
    "github.com/smartcontractkit/chainlink-testing-framework/sentinel/blockchain_client_wrapper"
    "github.com/smartcontractkit/chainlink-testing-framework/sentinel/sentinel"
)

func main() {
    // Initialize logger and Sentinel as shown above

    // Setup blockchain client (e.g., Geth)
    client, err := ethclient.Dial("https://mainnet.infura.io/v3/YOUR-PROJECT-ID")
    if err != nil {
        panic("Failed to connect to blockchain client: " + err.Error())
    }
    wrappedClient := blockchain_client_wrapper.NewGethClientWrapper(client)

    // Add a new chain to Sentinel
    err = sentinelCoordinator.AddChain(sentinel.AddChainConfig{
        ChainID:          1, // Ethereum Mainnet
        PollInterval:     10 * time.Second,
        BlockchainClient: wrappedClient,
    })
    if err != nil {
        panic("Failed to add chain: " + err.Error())
    }
}
Subscribe to Events
Subscribe to blockchain events:
package main

import (
    "fmt"

    "github.com/ethereum/go-ethereum/common"
    "github.com/smartcontractkit/chainlink-testing-framework/sentinel/api"
)

func main() {
    // Initialize logger, Sentinel, and add a chain as shown above

    // Define the address and topic to subscribe to
    address := common.HexToAddress("0x1234567890abcdef1234567890abcdef12345678")
    topic := common.HexToHash("0xabcdefabcdefabcdefabcdefabcdefabcdefabcdef")

    // Subscribe to the event
    logCh, err := sentinelCoordinator.Subscribe(1, address, topic)
    if err != nil {
        panic("Failed to subscribe: " + err.Error())
    }
    defer sentinelCoordinator.Unsubscribe(1, address, topic, logCh)

    // Listen for logs in a separate goroutine
    go func() {
        for log := range logCh {
            fmt.Printf("Received log: %+v\n", log)
        }
    }()
}
Unsubscribe
Unsubscribe from events:
package main

func main() {
    // Initialize logger, Sentinel, add a chain, and subscribe as shown above

    // Assume logCh is the channel obtained from Subscribe
    err = sentinelCoordinator.Unsubscribe(1, address, topic, logCh)
    if err != nil {
        panic("Failed to unsubscribe: " + err.Error())
    }
}
Remove a Chain
Remove a blockchain from monitoring:
package main

func main() {
    // Initialize logger, Sentinel, add a chain, and subscribe as shown above

    // Remove the chain
    err = sentinelCoordinator.RemoveChain(1)
    if err != nil {
        panic("Failed to remove chain: " + err.Error())
    }
}
API Reference
Sentinel
-
NewSentinel(config SentinelConfig) *Sentinel
Initializes a new Sentinel instance. -
AddChain(config AddChainConfig) error
Adds a new blockchain chain to Sentinel. -
RemoveChain(chainID int64) error
Removes an existing chain from Sentinel. -
Subscribe(chainID int64, address common.Address, topic common.Hash) (chan api.Log, error)
Subscribes to a specific event on a given chain. -
Unsubscribe(chainID int64, address common.Address, topic common.Hash, ch chan api.Log) error
Unsubscribes from a specific event.
Testing
Run Tests
Run the comprehensive test suite using:
go test -race ./... -v
Legacy libraries
Here we list libs and docs which are no longer used and will be sunset next release
- v1 Libraries - docs are removed, Go code will be removed next release
- Havoc - migrating to Griddle Chaos Stack
- BenchSpy - sunsetting, migrating to using Go code + alerts to assert
Havoc

The havoc package is designed to facilitate chaos testing within Kubernetes environments using Chaos Mesh. It offers a structured way to define, execute, and manage chaos experiments as code, directly integrated into Go applications or testing suites, simplifying the creation and control of Chaos Mesh experiments.
Features
- Chaos Object Management: Create, update, pause, resume, and delete chaos experiments using Go structures and methods.
- Lifecycle Hooks: Utilize chaos listeners to hook into the lifecycle of chaos experiments.
- Different Experiments: Create and manage different types of chaos experiments to affect network, IO, K8s pods, and more.
- Active Monitoring: Monitor and react to the status of chaos experiments programmatically.
Requirements
- Go
- A Kubernetes cluster with Chaos Mesh installed
Active Monitoring
havoc enhances chaos experiment observability through structured logging and Grafana annotations by implementing the ChaosListener interface.
The ChaosLogger is the default implementation. It uses zerolog to provide structured, queryable logging of chaos events. It automatically logs key lifecycle events such as creation, start, pause, and termination of chaos experiments with detailed contextual information.
Grafana Annotations
We recommend using Grafana dashboards to monitor your chaos experiments, and provide the SingleLineGrafanaAnnotator, a ChaosListener that annotates dashboards with chaos experiment events so you can see in real time what your chaos experiment is doing.
You can also use the RangeGrafanaAnnotator to show the full range of a chaos event's duration rather than a single line.
Creating a Chaos Experiment
To create a chaos experiment, define the chaos object options, initialize a chaos experiment with NewChaos, and then call Create to start the experiment.
See this runnable example of defining a chaos experiment.
BenchSpy
BenchSpy (short for Benchmark Spy) is a WASP-coupled tool designed for easy comparison of various performance metrics.
Key Features
- Three built-in data sources:
LokiPrometheusDirect
- Standard/pre-defined metrics for each data source.
- Ease of extensibility with custom metrics.
- Ability to load the latest performance report based on Git history.
BenchSpy does not include any built-in comparison logic beyond ensuring that performance reports are comparable (e.g., they measure the same metrics in the same way), offering complete freedom to the user for interpretation and analysis.
Why could you need it?
BenchSpy was created with two main goals in mind:
- measuring application performance programmatically,
- finding performance-related changes or regression issues between different commits or releases.
BenchSpy - Getting Started
The following examples assume you have access to the following applications:
- Grafana
- Loki
- Prometheus
note
The easiest way to run these locally is by using CTFv2's observability stack.
Be sure to install the CTF CLI first, as described in the CTFv2 Getting Started guide.
Since BenchSpy is tightly coupled with WASP, we highly recommend that you get familiar with it first if you haven't already.
Ready? Let's get started!
note
You can BENCHSPY_LOG_LEVEL environment variable to control the log level.
BenchSpy - Your First Test
Let's start with the simplest case, which doesn't require any part of the observability stack—only WASP and the application you are testing.
BenchSpy comes with built-in QueryExecutors, each of which also has predefined metrics that you can use. One of these executors is the DirectQueryExecutor, which fetches metrics directly from WASP generators,
which means you can run it with Loki.
note
Not sure whether to use Loki or Direct query executors? Read this!
Test Overview
Our first test will follow this logic:
- Run a simple load test.
- Generate a performance report and store it.
- Run the load test again.
- Generate a new report and compare it to the previous one.
We'll use very simplified assertions for this example and expect the performance to remain unchanged.
Step 1: Define and Run a Generator
Let's start by defining and running a generator that uses a mocked service:
gen, err := wasp.NewGenerator(&wasp.Config{
    T:           t,
    GenName:     "vu",
    CallTimeout: 100 * time.Millisecond,
    LoadType:    wasp.VU,
    Schedule:    wasp.Plain(10, 15*time.Second),
    VU: wasp.NewMockVU(&wasp.MockVirtualUserConfig{
        CallSleep: 50 * time.Millisecond,
    }),
})
require.NoError(t, err)
gen.Run(true)
Step 2: Generate a Baseline Performance Report
With load data available, let's generate a baseline performance report and store it in local storage:
baseLineReport, err := benchspy.NewStandardReport(
    // random hash, this should be the commit or hash of the Application Under Test (AUT)
    "v1.0.0",
    // use built-in queries for an executor that fetches data directly from the WASP generator
    benchspy.WithStandardQueries(benchspy.StandardQueryExecutor_Direct),
    // WASP generators
    benchspy.WithGenerators(gen),
)
require.NoError(t, err, "failed to create baseline report")

fetchCtx, cancelFn := context.WithTimeout(context.Background(), 60*time.Second)
defer cancelFn()

fetchErr := baseLineReport.FetchData(fetchCtx)
require.NoError(t, fetchErr, "failed to fetch data for baseline report")

path, storeErr := baseLineReport.Store()
require.NoError(t, storeErr, "failed to store baseline report", path)
note
There's a lot to unpack here, and you're encouraged to read more about the built-in QueryExecutors and the standard metrics they provide as well as about the StandardReport here.
For now, it's enough to know that the standard metrics provided by StandardQueryExecutor_Direct include:
- Median latency
- P95 latency (95th percentile)
- Max latency
- Error rate
Step 3: Run the Test Again and Compare Reports
With the baseline report ready, let's run the load test again. This time, we'll use a wrapper function to automatically load the previous report, generate a new one, and ensure they are comparable.
// define a new generator using the same config values
newGen, err := wasp.NewGenerator(&wasp.Config{
    T:           t,
    GenName:     "vu",
    CallTimeout: 100 * time.Millisecond,
    LoadType:    wasp.VU,
    Schedule:    wasp.Plain(10, 15*time.Second),
    VU: wasp.NewMockVU(&wasp.MockVirtualUserConfig{
        CallSleep: 50 * time.Millisecond,
    }),
})
require.NoError(t, err)

// run the load
newGen.Run(true)

fetchCtx, cancelFn = context.WithTimeout(context.Background(), 60*time.Second)
defer cancelFn()

// currentReport is the report that we just created (baseLineReport)
currentReport, previousReport, err := benchspy.FetchNewStandardReportAndLoadLatestPrevious(
    fetchCtx,
    // commit or tag of the new application version
    "v2.0.0",
    benchspy.WithStandardQueries(benchspy.StandardQueryExecutor_Direct),
    benchspy.WithGenerators(newGen),
)
require.NoError(t, err, "failed to fetch current report or load the previous one")
note
In a real-world case, once you've generated the first report, you should only need to use the benchspy.FetchNewStandardReportAndLoadLatestPrevious function.
What's Next?
Now that we have two reports, how do we ensure that the application's performance meets expectations? Find out in the next chapter.
BenchSpy - Simplest Metrics
As mentioned earlier, BenchSpy doesn't include any built-in comparison logic. It's up to you to decide how to compare metrics, as there are various ways to approach it and different data formats returned by queries.
For example, if your query returns a time series, you could:
- Compare each data point in the time series individually.
- Compare aggregates like averages, medians, or min/max values of the time series.
Working with Built-in QueryExecutors
Each built-in QueryExecutor returns a different data type, and we use the interface{} type to reflect this. Since Direct executor always returns float64 we have added a convenience function
that checks whether any of the standard metrics has degraded more than the threshold. If the performance has improved, no error will be returned.
hasErrors, errors := benchspy.CompareDirectWithThresholds(
    // maximum differences in percentages for:
    1.0, // median latency
    1.0, // p95 latency
    1.0, // p99 latency
    1.0, // max latency
    1.0, // error rate
    currentReport,
    previousReport,
)
require.False(t, hasErrors, fmt.Sprintf("errors found: %v", errors))
If there are errors they will be returned as map[string][]errors, where key is the name of a generator.
note
Both Direct and Loki query executors support following standard performance metrics out of the box:
median_latencyp95_latencyp99_latencymax_latencyerror_rate
The function also prints a table with the differences between two reports, regardless whether they were meaningful:
Generator: vu1
==============
+-------------------------+---------+---------+---------+
|         METRIC          |   V1    |   V2    | DIFF %  |
+-------------------------+---------+---------+---------+
| median_latency          | 50.1300 | 50.1179 | -0.0242 |
+-------------------------+---------+---------+---------+
| 95th_percentile_latency | 50.7387 | 50.7622 | 0.0463  |
+-------------------------+---------+---------+---------+
| 99th_percentile_latency | 54.8192 | 51.0124 | -7.4624 |
+-------------------------+---------+---------+---------+
| max_latency             | 55.7195 | 51.7248 | -7.1692 |
+-------------------------+---------+---------+---------+
| error_rate              | 0.0000  | 0.0000  | 0.0000  |
+-------------------------+---------+---------+---------+
Wrapping Up
And that's it! You've written your first test that uses WASP to generate load and BenchSpy to ensure that the median latency, 95th percentile latency, max latency and error rate haven't changed significantly between runs. You accomplished this without even needing a Loki instance. But what if you wanted to leverage the power of LogQL? We'll explore that in the next chapter.
note
You can find the full example here.
BenchSpy - Standard Loki Metrics
warning
This example assumes you have access to Loki and Grafana instances. If you don't, learn how to launch them using CTFv2's observability stack.
In this example, our Loki workflow will differ from the previous one in just a few details:
- The generator will include a Loki configuration.
- The standard query executor type will be
benchspy.StandardQueryExecutor_Loki. - All results will be cast to
[]string. - We'll calculate medians for all metrics.
Ready?
Step 1: Define a New Load Generator
Let's start by defining a new load generator:
label := "benchspy-std"

gen, err := wasp.NewGenerator(&wasp.Config{
    T:          t,
    // read Loki config from environment
    LokiConfig: wasp.NewEnvLokiConfig(),
    GenName:    "vu",
    // set unique labels
    Labels: map[string]string{
        "branch": label,
        "commit": label,
    },
    CallTimeout: 100 * time.Millisecond,
    LoadType:    wasp.VU,
    Schedule:    wasp.Plain(10, 15*time.Second),
    VU: wasp.NewMockVU(&wasp.MockVirtualUserConfig{
        CallSleep: 50 * time.Millisecond,
    }),
})
require.NoError(t, err)
Step 2: Run the Generator and Save the Baseline Report
gen.Run(true)

baseLineReport, err := benchspy.NewStandardReport(
    "v1.0.0",
    // notice the different standard query executor type
    benchspy.WithStandardQueries(benchspy.StandardQueryExecutor_Loki),
    benchspy.WithGenerators(gen),
)
require.NoError(t, err, "failed to create baseline report")

fetchCtx, cancelFn := context.WithTimeout(context.Background(), 60*time.Second)
defer cancelFn()

fetchErr := baseLineReport.FetchData(fetchCtx)
require.NoError(t, fetchErr, "failed to fetch data for baseline report")

path, storeErr := baseLineReport.Store()
require.NoError(t, storeErr, "failed to store baseline report", path)
Step 3: Skip to Metrics Comparison
Since the next steps are very similar to those in the first test, we’ll skip them and go straight to metrics comparison.
By default, the LokiQueryExecutor returns results as the []string data type. Let’s use dedicated convenience functions to cast them from interface{} to string slices:
allCurrentAsStringSlice := benchspy.MustAllLokiResults(currentReport)
allPreviousAsStringSlice := benchspy.MustAllLokiResults(previousReport)

require.NotEmpty(t, allCurrentAsStringSlice, "current report is empty")
require.NotEmpty(t, allPreviousAsStringSlice, "previous report is empty")

currentAsStringSlice := allCurrentAsStringSlice[gen.Cfg.GenName]
previousAsStringSlice := allPreviousAsStringSlice[gen.Cfg.GenName]
An explanation is needed here: this function separates metrics for each generator, hence it returns a map[string]map[string][]string. Let's break it down:
- outer map's key is generator name
- inner map's key is metric name and the value is a series of measurements In our case there's only a single generator, but in a complex test there might be a few.
Step 4: Compare Metrics
Now, let’s compare metrics. Since we have []string, we’ll first convert it to []float64, calculate the median, and ensure the difference between the averages is less than 1%. Again, this is just an example—you should decide the best way to validate your metrics. Here we are explicitly aggregating them using an average to get a single number representation of each metric, but for your case a median or percentile or yet some other aggregate might be more appropriate.
var compareAverages = func(t *testing.T, metricName string, currentAsStringSlice, previousAsStringSlice map[string][]string, maxPrecentageDiff float64) {
	require.NotEmpty(t, currentAsStringSlice[metricName], "%s results were missing from current report", metricName)
	require.NotEmpty(t, previousAsStringSlice[metricName], "%s results were missing from previous report", metricName)

	currentFloatSlice, err := benchspy.StringSliceToFloat64Slice(currentAsStringSlice[metricName])
	require.NoError(t, err, "failed to convert %s results to float64 slice", metricName)
	currentMedian, err := stats.Mean(currentFloatSlice)
	require.NoError(t, err, "failed to calculate median for %s results", metricName)

	previousFloatSlice, err := benchspy.StringSliceToFloat64Slice(previousAsStringSlice[metricName])
	require.NoError(t, err, "failed to convert %s results to float64 slice", metricName)
	previousMedian, err := stats.Mean(previousFloatSlice)
	require.NoError(t, err, "failed to calculate median for %s results", metricName)

	var diffPrecentage float64
	if previousMedian != 0.0 && currentMedian != 0.0 {
		diffPrecentage = (currentMedian - previousMedian) / previousMedian * 100
	} else if previousMedian == 0.0 && currentMedian == 0.0 {
		diffPrecentage = 0.0
	} else {
		diffPrecentage = 100.0
	}
	assert.LessOrEqual(t, math.Abs(diffPrecentage), maxPrecentageDiff, "%s medians are more than 1% different", metricName, fmt.Sprintf("%.4f", diffPrecentage))
}

compareAverages(t, string(benchspy.MedianLatency), currentAsStringSlice, previousAsStringSlice, 1.0)
compareAverages(t, string(benchspy.Percentile95Latency), currentAsStringSlice, previousAsStringSlice, 1.0)
compareAverages(t, string(benchspy.Percentile99Latency), currentAsStringSlice, previousAsStringSlice, 1.0)
compareAverages(t, string(benchspy.MaxLatency), currentAsStringSlice, previousAsStringSlice, 1.0)
compareAverages(t, string(benchspy.ErrorRate), currentAsStringSlice, previousAsStringSlice, 1.0)
warning
Standard Loki metrics are all calculated using a 10 seconds moving window, which results in smoothing of values due to aggregation. To learn what that means in details, please refer to To Loki or Not to Loki chapter.
Also, due to the HTTP API endpoint used, namely the query_range, all query results are always returned as a slice. Execution of instant queries
that return a single data point is currently not supported.
What’s Next?
In this example, we used standard metrics, which are the same as in the first test. Now, let’s explore how to use your custom LogQL queries.
note
You can find the full example here.
BenchSpy - Custom Loki Metrics
In this chapter, we’ll explore how to use custom LogQL queries in the performance report. For this more advanced use case, we’ll manually compose the performance report.
The load generation part is the same as in the standard Loki metrics example and will be skipped.
Defining Custom Metrics
Let’s define two illustrative metrics:
vu_over_time: The rate of virtual users generated by WASP, using a 10-second window.responses_over_time: The number of AUT's responses, using a 1-second window.
lokiQueryExecutor := benchspy.NewLokiQueryExecutor(
    map[string]string{
        "vu_over_time":        fmt.Sprintf("max_over_time({branch=~\"%s\", commit=~\"%s\", go_test_name=~\"%s\", test_data_type=~\"stats\", gen_name=~\"%s\"} | json | unwrap current_instances [10s]) by (node_id, go_test_name, gen_name)", label, label, t.Name(), gen.Cfg.GenName),
        "responses_over_time": fmt.Sprintf("sum(count_over_time({branch=~\"%s\", commit=~\"%s\", go_test_name=~\"%s\", test_data_type=~\"responses\", gen_name=~\"%s\"} [1s])) by (node_id, go_test_name, gen_name)", label, label, t.Name(), gen.Cfg.GenName),
    },
    gen.Cfg.LokiConfig,
)
note
These LogQL queries use the standard labels that WASP applies when sending data to Loki.
Creating a StandardReport with Custom Queries
Now, let’s create a StandardReport using our custom queries:
baseLineReport, err := benchspy.NewStandardReport(
    "v1.0.0",
    // notice the different functional option used to pass Loki executor with custom queries
    benchspy.WithQueryExecutors(lokiQueryExecutor),
    benchspy.WithGenerators(gen),
)
require.NoError(t, err, "failed to create baseline report")
Wrapping Up
The rest of the code remains unchanged, except for the names of the metrics being asserted. You can find the full example here.
Now it’s time to look at the last of the bundled QueryExecutors. Proceed to the next chapter to read about Prometheus.
note
You can find the full example here.
BenchSpy - Standard Prometheus Metrics
Now that we've seen how to query and assert load-related metrics, let's explore how to query and assert on resource usage by our Application Under Test (AUT).
If you're unsure why this is important, consider the following situation: the p95 latency of a new release matches the previous version, but memory consumption is 34% higher. Not ideal, right?
Step 1: Prometheus Configuration
Since WASP has no built-in integration with Prometheus, we need to pass its configuration separately:
promConfig := benchspy.NewPrometheusConfig("node[^0]")
This constructor loads the URL from the environment variable PROMETHEUS_URL and adds a single regex pattern to match containers by name. In this case, it excludes the bootstrap Chainlink node (named node0 in the CTFv2 stack).
warning
This example assumes that you have both the observability stack and basic node set running.
If you have the CTF CLI, you can start it by running: ctf b ns.
note
Matching containers by name should work both for most k8s and Docker setups using CTFv2 observability stack.
Step 2: Fetching and Storing a Baseline Report
As in previous examples, we'll use built-in Prometheus metrics and fetch and store a baseline report:
baseLineReport, err := benchspy.NewStandardReport(
    "91ee9e3c903d52de12f3d0c1a07ac3c2a6d141fb",
    // notice the different standard query executor type
    benchspy.WithStandardQueries(benchspy.StandardQueryExecutor_Prometheus),
    benchspy.WithPrometheusConfig(promConfig),
    // Required to calculate test time range based on generator start/end times.
    benchspy.WithGenerators(gen),
)
require.NoError(t, err, "failed to create baseline report")

fetchCtx, cancelFn := context.WithTimeout(context.Background(), 60*time.Second)
defer cancelFn()

fetchErr := baseLineReport.FetchData(fetchCtx)
require.NoError(t, fetchErr, "failed to fetch baseline report")

path, storeErr := baseLineReport.Store()
require.NoError(t, storeErr, "failed to store baseline report", path)
note
Standard metrics for Prometheus differ from those used by Loki or Direct query executors.
Prometheus metrics focus on resource usage by the AUT, while Loki/Direct metrics measure load characteristics.
Standard Prometheus metrics include:
median_cpu_usagemedian_mem_usagemax_cpu_usagep95_cpu_usagep95_mem_usagemax_mem_usage
These are calculated at the container level, based on total usage (user + system).
Step 3: Handling Prometheus Result Types
Unlike Loki and Generator, Prometheus results can have various data types:
scalarstringvectormatrix
This makes asserting results a bit more complex.
Converting Results to model.Value
First, convert results to the model.Value interface using convenience functions:
currentAsValues := benchspy.MustAllPrometheusResults(currentReport)
previousAsValues := benchspy.MustAllPrometheusResults(previousReport)
Casting to Specific Types
Next, determine the data type returned by your query and cast it accordingly:
// Fetch a single metric
currentMedianCPUUsage := currentAsValues[string(benchspy.MedianCPUUsage)]
previousMedianCPUUsage := previousAsValues[string(benchspy.MedianCPUUsage)]

assert.Equal(t, currentMedianCPUUsage.Type(), previousMedianCPUUsage.Type(), "types of metrics should be the same")

// In this case, we know the query returns a Vector
currentMedianCPUUsageVector := currentMedianCPUUsage.(model.Vector)
previousMedianCPUUsageVector := previousMedianCPUUsage.(model.Vector)
Since these metrics are not related to load generation, the convenience function a map[string](model.Value), where key is resource metric name.
warning
All standard Prometheus metrics bundled with BenchSpy return model.Vector.
However, if you use custom queries, you must manually verify their return types.
Skipping Assertions for Resource Usage
We skip the assertion part because, unless you're comparing resource usage under stable loads, significant differences between reports are likely. For example:
- The first report might be generated right after the node set starts.
- The second report might be generated after the node set has been running for some time.
What’s Next?
In the next chapter, we’ll explore custom Prometheus queries.
note
You can find the full example here.
BenchSpy - Custom Prometheus Metrics
Similar to what we did with Loki, we can use custom metrics with Prometheus.
Most of the code remains the same as in the previous example. However, the differences begin with the need to manually create a PrometheusQueryExecutor with our custom queries:
// No need to pass the name regex pattern, as we provide it directly in the queries
// Remeber that you are free to use any other matching values or labels or none at all
promConfig := benchspy.NewPrometheusConfig()

customPrometheus, err := benchspy.NewPrometheusQueryExecutor(
    map[string]string{
        // Scalar value
        "95p_cpu_all_containers": "scalar(quantile(0.95, rate(container_cpu_usage_seconds_total{name=~\"node[^0]\"}[5m])) * 100)",
        // Matrix value
        "cpu_rate_by_container": "rate(container_cpu_usage_seconds_total{name=~\"node[^0]\"}[1m])[30m:1m]",
    },
    promConfig,
)
Passing Custom Queries to the Report
Next, pass the custom queries as a query executor:
baseLineReport, err := benchspy.NewStandardReport(
    "91ee9e3c903d52de12f3d0c1a07ac3c2a6d141fb",
    // notice the different functional option used to pass Prometheus executor with custom queries
    benchspy.WithQueryExecutors(customPrometheus),
    benchspy.WithGenerators(gen),
    // notice that no Prometehus config is passed here
)
require.NoError(t, err, "failed to create baseline report")
note
When using custom Prometheus queries, you don’t need to pass the PrometheusConfig to NewStandardReport(), as the URL already been set during the creation of the PrometheusQueryExecutor.
Fetching and Casting Metrics
Fetching the current and previous reports remains unchanged, as does casting Prometheus metrics to their specific types:
currentAsValues := benchspy.MustAllPrometheusResults(currentReport)
previousAsValues := benchspy.MustAllPrometheusResults(previousReport)

assert.Equal(t, len(currentAsValues), len(previousAsValues), "number of metrics in results should be the same")
Handling Different Data Types
Here’s where things differ. While all standard query results are instances of model.Vector, the two custom queries introduce new types:
model.Matrix*model.Scalar
These differences are reflected in the further casting process before accessing the final metrics:
current95CPUUsage := currentAsValues["95p_cpu_all_containers"]
previous95CPUUsage := previousAsValues["95p_cpu_all_containers"]

assert.Equal(t, current95CPUUsage.Type(), previous95CPUUsage.Type(), "types of metrics should be the same")
assert.IsType(t, current95CPUUsage, &model.Scalar{}, "current metric should be a scalar")

currentCPUByContainer := currentAsValues["cpu_rate_by_container"]
previousCPUByContainer := previousAsValues["cpu_rate_by_container"]

assert.Equal(t, currentCPUByContainer.Type(), previousCPUByContainer.Type(), "types of metrics should be the same")
assert.IsType(t, currentCPUByContainer, model.Matrix{}, "current metric should be a scalar")

current95CPUUsageAsMatrix := currentCPUByContainer.(model.Matrix)
previous95CPUUsageAsMatrix := currentCPUByContainer.(model.Matrix)

assert.Equal(t, len(current95CPUUsageAsMatrix), len(previous95CPUUsageAsMatrix), "number of samples in matrices should be the same")
warning
When casting to Prometheus' final types, it’s crucial to remember the distinction between pointer and value receivers:
Pointer receivers:
*model.String*model.Scalar
Value receivers:
model.Vectormodel.Matrix
And that's it! You know all you need to know to unlock the full power of BenchSpy!
note
You can find the full example here.
BenchSpy - To Loki or Not to Loki?
You might be wondering whether to use the Loki or Direct query executor if all you need are basic latency metrics.
Rule of Thumb
You should opt for the Direct query executor if all you need is a single number, such as the median latency or error rate, and you're not interested in:
- Comparing time series directly,
- Examining minimum or maximum values over time, or
- Performing advanced calculations on raw data,
Why Choose Direct?
The Direct executor returns a single value for each standard metric using the same raw data that Loki would use. It accesses data stored in the WASP generator, which is later pushed to Loki.
This means you can:
- Run your load test without a Loki instance.
- Avoid calculating metrics like the median, 95th percentile latency, or error ratio yourself.
By using Direct, you save resources and simplify the process when advanced analysis isn't required.
warning
Metrics calculated by the two query executors may differ slightly due to differences in their data processing and calculation methods:
DirectQueryExecutor: This method processes all individual data points from the raw dataset, ensuring that every value is taken into account for calculations like averages, percentiles, or other statistics. It provides the most granular and precise results but may also be more sensitive to outliers and noise in the data.LokiQueryExecutor: This method aggregates data using a default window size of 10 seconds. Within each window, multiple raw data points are combined (e.g., through averaging, summing, or other aggregation functions), which reduces the granularity of the dataset. While this approach can improve performance and reduce noise, it also smooths the data, which may obscure outliers or small-scale variability.
Why This Matters for Percentiles:
Percentiles, such as the 95th percentile (p95), are particularly sensitive to the granularity of the input data:
- In the
DirectQueryExecutor, the p95 is calculated across all raw data points, capturing the true variability of the dataset, including any extreme values or spikes.- In the
LokiQueryExecutor, the p95 is calculated over aggregated data (i.e. using the 10-second window). As a result, the raw values within each window are smoothed into a single representative value, potentially lowering or altering the calculated p95. For example, an outlier that would significantly affect the p95 in theDirectcalculation might be averaged out in theLokiwindow, leading to a slightly lower percentile value.
Direct caveats:
buffer limitations:
WASPgenerator use a StringBuffer with fixed size to store the responses. Once full capacity is reached oldest entries are replaced with incoming ones. The size of the buffer can be set in generator's config. By default, it is limited to 50k entries to lower resource consumption and potential OOMs.sampling:
WASPgenerators support optional sampling of successful responses. It is disabled by deafult, but if you do enable it, then the calculations would no longer be done over a full dataset.
Key Takeaway:
The difference arises because
Directprioritizes precision by using raw data, whileLokiprioritizes efficiency and scalability by using aggregated data. When interpreting results, it’s essential to consider how the smoothing effect ofLokimight impact the representation of variability or extremes in the dataset. This is especially important for metrics like percentiles, where such details can significantly influence the outcome.
BenchSpy - Real-World Example
Now that we've covered all possible usages, you might wonder how to write a test that compares performance between different releases of your application. Here’s a practical example to guide you through the process.
Typical Workflow
- Write a performance test.
- At the end of the test, generate a performance report, store it, and commit it to Git.
- Modify the test to fetch both the latest report and create a new one.
- Write assertions to validate your performance metrics.
Writing the Performance Test
We'll use a simple mock for the application under test. This mock waits for 50 ms before returning a 200 response code.
generator, err := wasp.NewGenerator(&wasp.Config{
    T:           t,
    GenName:     "vu",
    CallTimeout: 100 * time.Millisecond,
    LoadType:    wasp.VU,
    Schedule:    wasp.Plain(10, 15*time.Second),
    VU: wasp.NewMockVU(&wasp.MockVirtualUserConfig{
        CallSleep: 50 * time.Millisecond,
    }),
})
require.NoError(t, err)
generator.Run(true)
Generating the First Report
Here, we'll generate a performance report for version v1.0.0 using the Direct query executor. The report will be saved to a custom directory named test_reports. This report will later be used to compare the performance of new versions.
fetchCtx, cancelFn := context.WithTimeout(context.Background(), 60*time.Second)
defer cancelFn()

baseLineReport, err := benchspy.NewStandardReport(
    "v1.0.0",
    benchspy.WithStandardQueries(benchspy.StandardQueryExecutor_Direct),
    benchspy.WithReportDirectory("test_reports"),
    benchspy.WithGenerators(gen),
)
require.NoError(t, err, "failed to create baseline report")

fetchErr := baseLineReport.FetchData(fetchCtx)
require.NoError(t, fetchErr, "failed to fetch data for original report")

path, storeErr := baseLineReport.Store()
require.NoError(t, storeErr, "failed to store current report", path)
Modifying Report Generation
With the baseline report for v1.0.0 stored, we'll modify the test to support future releases. The code from the previous step will change as follows:
currentVersion := os.Getenv("CURRENT_VERSION")
require.NotEmpty(t, currentVersion, "No current version provided")

fetchCtx, cancelFn := context.WithTimeout(context.Background(), 60*time.Second)
defer cancelFn()

currentReport, previousReport, err := benchspy.FetchNewStandardReportAndLoadLatestPrevious(
    fetchCtx,
    currentVersion,
    benchspy.WithStandardQueries(benchspy.StandardQueryExecutor_Direct),
    benchspy.WithReportDirectory("test_reports"),
    benchspy.WithGenerators(generator),
)
require.NoError(t, err, "failed to fetch current report or load the previous one")
This function fetches the current report (for version passed as environment variable CURRENT_VERSION) while loading the latest stored report from the test_reports directory.
Adding Assertions
Let’s assume you want to ensure that none of the performance metrics degrade by more than 1% between releases (and that error rate has not changed at all). Here's how you can write assertions using a convenient function for the Direct query executor:
hasFailed, error := benchspy.CompareDirectWithThresholds(
    1.0, // Max 1% worse median latency
    1.0, // Max 1% worse p95 latency
    1.0, // Max 1% worse p99 latency
    1.0, // Max 1% worse maximum latency
    0.0, // No increase in error rate
    currentReport, previousReport)
require.False(t, hasError, fmt.Sprintf("issues found: %v", error))
Error returned by this function is a concatenation of all threshold violations found for each standard metric and generator.
Conclusion
You’re now ready to use BenchSpy to ensure that your application’s performance does not degrade below your specified thresholds!
note
Here you can find an example test where performance has degraded significantly,
because mock's latency has been increased from 50ms to 60ms.
This test passes because it is designed to expect performance degradation. Of course, in a real application, your goal should be to prevent such regressions. 😊
BenchSpy - Debugging
If you run into any issues with BenchSpy it might help to lower the default logging level to either debug or trace. It's controlled by environment variable called BENCHSPY_LOG_LEVEL.
BenchSpy - Reports
BenchSpy was designed with composability in mind. It includes a StandardReport implementation that should cover the majority of use cases while also allowing for the creation of fully customized reports with ease.
Learn more about the StandardReport in the next chapter.
BenchSpy - Standard Report
StandardReport supports three types of data sources:
DirectLokiPrometheus
Each allows you to use either pre-defined metrics or create custom ones.
Pre-defined (Standard) Metrics
Direct and Loki
Both query executors focus on the characteristics of the load generated by WASP. Their datasets are nearly identical because the Direct executor queries load-specific data before it is sent to Loki. The Loki executor, however, offers richer querying options (via LogQL) and access to the actual load profile (rather than the configured one).
Predefined metrics for both include:
- Median latency
- 95th percentile latency
- 99th percentile latency
- Max latency
- Error rate
Latency is the round-trip time from sending a request to receiving a response from the Application Under Test (AUT).
Error rate is the ratio of failed responses to total responses. This includes requests that timed out or returned errors from Gun or Vu implementations.
Prometheus
Prometheus metrics focus on resource consumption by the AUT rather than load generation. These metrics include:
- Median CPU usage
- 95th percentile CPU usage
- Max CPU usage
- Median memory usage
- 95th percentile memory usage
- Max memory usage
Prometheus queries focus on total consumption, which combines the usage of the underlying system and your application.
How to Use Pre-defined Metrics
To use pre-defined metrics, call the NewStandardReport method:
report, err := benchspy.NewStandardReport(
    "v1.1.1",
    // Query executor types for which standard metrics should be generated
    benchspy.WithStandardQueries(
        benchspy.StandardQueryExecutor_Prometheus,
        benchspy.StandardQueryExecutor_Loki,
    ),
    // Prometheus configuration is required if using standard Prometheus metrics
    benchspy.WithPrometheusConfig(benchspy.NewPrometheusConfig("node[^0]")),
    // WASP generators
    benchspy.WithGenerators(gen),
)
require.NoError(t, err, "failed to create the report")
Custom Metrics
WASP Generator
Since WASP stores AUT responses in each generator, you can create custom metrics based on this data. For example, to calculate the timeout ratio:
var generator *wasp.Generator

var timeouts = func(responses *wasp.SliceBuffer[*wasp.Response]) (float64, error) {
    if len(responses.Data) == 0 {
        return 0, nil
    }

    timeoutCount := 0.0
    inTimeCount := 0.0
    for _, response := range responses.Data {
        if response.Timeout {
            timeoutCount++
        } else {
            inTimeCount++
        }
    }

    return timeoutCount / (timeoutCount + inTimeCount), nil
}

directExecutor, err := NewDirectQueryExecutor(generator, map[string]DirectQueryFn{
    "timeout_ratio": timeouts,
})
require.NoError(t, err, "failed to create Direct Query Executor")
Loki
Creating custom LogQL queries is even simpler. Use NewLokiQueryExecutor with a map of desired queries:
var generator *wasp.Generator

lokiQueryExecutor := benchspy.NewLokiQueryExecutor(
    map[string]string{
        "responses_over_time": fmt.Sprintf("sum(count_over_time({my_label=~\"%s\", test_data_type=~\"responses\", gen_name=~\"%s\"} [5s])) by (node_id, gen_name)", label, gen.Cfg.GenName),
    },
    generator.Cfg.LokiConfig,
)
note
To write effective LogQL queries for WASP, familiarize yourself with generator labeling and the test_data_types used by WASP.
Prometheus
Adding custom PromQL queries is equally straightforward:
promConfig := benchspy.NewPrometheusConfig()

prometheusExecutor, err := benchspy.NewPrometheusQueryExecutor(
    map[string]string{
        "cpu_rate_by_container": "rate(container_cpu_usage_seconds_total{name=~\"chainlink.*\"}[5m])[30m:1m]",
    },
    promConfig,
)
require.NoError(t, err)
Using Custom Queries with StandardReport
To use custom queries in a StandardReport, pass the custom QueryExecutors created above using the WithQueryExecutors option instead of the StandardQueryExecutorType:
report, err := benchspy.NewStandardReport(
    "v1.2.3",
    benchspy.WithQueryExecutors(directExecutor, lokiQueryExecutor, prometheusExecutor),
    benchspy.WithGenerators(gen),
)
require.NoError(t, err, "failed to create baseline report")
BenchSpy - Adding a New QueryExecutor
QueryExecutor interface
As mentioned earlier, the StandardReport supports three different data sources:
DirectLokiPrometheus
Each of these implements the QueryExecutor interface:
type QueryExecutor interface {
	// Kind returns the type of the QueryExecutor
	Kind() string
	// Validate checks if the QueryExecutor has all the necessary data and configuration to execute the queries
	Validate() error
	// Execute executes the queries and populates the QueryExecutor with the results
	Execute(ctx context.Context) error
	// Results returns the results of the queries, where the key is the query name and the value is the result
	Results() map[string]interface{}
	// IsComparable checks whether both QueryExecutors can be compared (e.g., they have the same type, queries, etc.),
	// and returns an error if any differences are found
	IsComparable(other QueryExecutor) error
	// TimeRange sets the time range for the queries
	TimeRange(startTime, endTime time.Time)
}
When creating a new QueryExecutor, most functions in this interface are straightforward. Below, we focus on two that may require additional explanation.
Kind
The Kind function should return a unique string identifier for your QueryExecutor. This identifier is crucial because StandardReport uses it when unmarshalling JSON files with stored reports.
Additionally, you need to extend the StandardReport.UnmarshalJSON function to support your new executor.
note
If your QueryExecutor includes interfaces, interface{} or any types, or fields that should not or cannot be serialized, ensure you implement custom MarshalJSON and UnmarshalJSON functions. Existing executors can provide useful examples.
TimeRange
The TimeRange method is called by StandardReport just before invoking Execute() for each executor. This method sets the time range for queries (required for Loki and Prometheus).
By default, StandardReport calculates the test time range automatically by analyzing the schedules of all generators and determining the earliest start time and latest end time. This eliminates the need for manual calculations.
With these details in mind, you should have a clear path to implementing your own QueryExecutor and integrating it seamlessly with BenchSpy's StandardReport.
NamedGenerator interface
Executors that query load generation metrics should also implement this simple interface:
type NamedGenerator interface {
	// GeneratorName returns the name of the generator
	GeneratorName() string
}
It is used primarly, when casting results from map[string]interface{} to target type, while splitting them between different generators.
Currently, this interface is implemented by Direct and Loki exectors, but not by Prometheus.
Defining a New Report
Each BenchSpy report must implement the Reporter interface, which handles three primary responsibilities:
- Storage and retrieval (
Storerinterface) - Data fetching (
DataFetcherinterface) - Comparison (
Comparatorinterface)
Reporter Interface
Definition
type Reporter interface {
	Storer
	DataFetcher
	Comparator
}
The comparison of actual performance data should not be part of the report itself. It should be done independently, ideally using Go's require and assert statements.
Storer Interface
Definition
type Storer interface {
	// Store stores the report in persistent storage and returns the path to it, or an error
	Store() (string, error)
	// Load loads the report from persistent storage based on the test name and commit/tag, or returns an error
	Load(testName, commitOrTag string) error
	// LoadLatest loads the latest report from persistent storage for the given test name, or returns an error
	LoadLatest(testName string) error
}
Usage
- If storing reports locally under Git satisfies your requirements, you can reuse the
LocalStorageimplementation ofStorer. - If you need to store reports in S3 or a database, you will need to implement the interface yourself.
DataFetcher Interface
Definition
type DataFetcher interface {
	// FetchData populates the report with data from the test
	FetchData(ctx context.Context) error
}
Purpose
This interface is solely responsible for fetching data from the data source and populating the report with results.
Comparator Interface
Definition
type Comparator interface {
// IsComparable checks whether two reports can be compared (e.g., test configuration, app resources, queries, and metrics are identical),
// and returns an error if any differences are found
IsComparable(otherReport Reporter) error
}
Purpose
This interface ensures that both reports are comparable by verifying:
- Both use generators with identical configurations (e.g., load type, load characteristics).
- Both reports feature the same data sources and queries.
This design provides flexibility and composability, allowing you to store, fetch, and compare reports in a way that fits your specific requirements.
Releasing Go modules
The Chainlink Testing Framework (CTF) repository contains multiple independent modules. To release any of them, we follow some best practices about breaking changes.
Release strategy
Use only lightweight tags
Do not move tags between commits. If something need to be fixed increment patch or minor version.
Steps to release:
- When all your PRs are merged to
maincheck themainbranch breaking changes badge - If there are no breaking changes for external methods, create a branch and explain all your module changes in
vX.X.X.mdcommitted under.changesetdir in your module. If changes are really short, and you run the script locally you can push.changesetas a part of your final feature PR - If there are accidental breaking changes, and it is possible to make them backward compatible - fix them
- If there are breaking changes, and we must release them change
go.modpath, add prefix/vX, merge your PR(s) - When all the changes are merged, and there are no breaking changes in the pipeline then proceed with releasing
- Tag
mainbranch in format$pkg/$subpkg/vX.X.Xaccording to your changes and push it, example:git tag $pkg/$subpkg/v1.1.0 && git push --tags git tag $pkg/$subpkg/v1.1.1 && git push --tags git tag $pkg/$subpkg/v2.0.0 && git push --tags - Check the release page
Binary releases
If your module have cmd/main.go we build binary automatically for various platforms and attach it to the release page.
Debugging release pipeline and gorelease tool
Checkout dummy-release-branch and release it:
git tag dummy-module/v0.X.0- Add
vX.X.X.mdin.changeset git push --no-verify --force && git push --tags- Check releases
Pipelines:
Check breaking changes locally
We have a simple wrapper to check breaking changes for all the packages. Commit all your changes and run:
go run ./tools/breakingchanges/cmd/main.go
go run ./tools/breakingchanges/cmd/main.go --subdir wasp # check recursively starting with subdir
go run ./tools/breakingchanges/cmd/main.go --ignore tools,wasp,havoc,seth # to ignore some packages
Build info
This documentation was generated from:
- Branch
main - Commit:
e2995e8e