Local Observability Stack
You can use a local observability stack, framework is connected to it by default
Default mode includes:
- Prometheus
- Loki
- OTEL-collector
- Grafana
# start the observability stack
ctf obs up
# remove the stack with all the data (volumes)
ctf obs d
# restart the stack removing all the data (volumes)
ctf obs r
Full stack has all the services above but also adds:
- Cadvisor
- Tempo
- Pyroscope
- PostgreSQL exporters for NodeSet databases
# start the observability stack
ctf obs up -f
# remove the stack with all the data (volumes)
ctf obs d -f
# restart the stack removing all the data (volumes)
ctf obs r -f
Read more about how to check logs and profiles
Developing
Change compose files under framework/cmd/observability and restart the stack (removing volumes too)
just reload-cli && ctf obs r
Local Dashboards (Docker)
You can create a dashboard using UI and put them under $pwd/dashboards folder then commit, they'll be loaded automatically on start and you can find them here under local directory.
$pwd is you current working directory from which you call ctf obs u
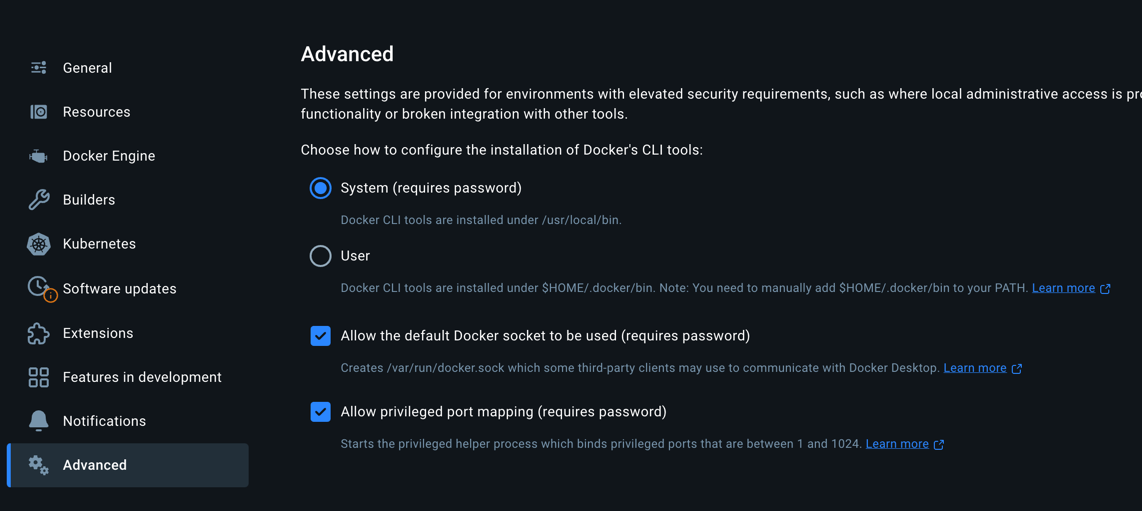
Troubleshooting
cadvisor is not working
Make sure your Advanced Docker settings look like this